


signal strength 1 of 5
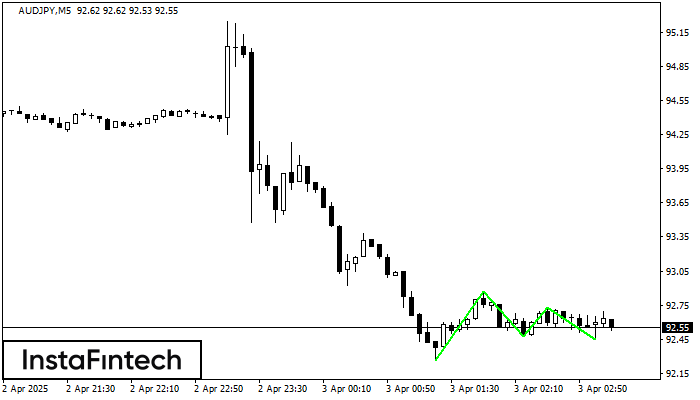
The Triple Bottom pattern has been formed on AUDJPY M5. It has the following characteristics: resistance level 92.87/92.73; support level 92.26/92.45; the width is 61 points. In the event of a breakdown of the resistance level of 92.87, the price is likely to continue an upward movement at least to 92.62.
The M5 and M15 time frames may have more false entry points.
See Also
- All
- Double Top
- Flag
- Head and Shoulders
- Pennant
- Rectangle
- Triangle
- Triple top
- All
- #AAPL
- #AMZN
- #Bitcoin
- #EBAY
- #FB
- #GOOG
- #INTC
- #KO
- #MA
- #MCD
- #MSFT
- #NTDOY
- #PEP
- #TSLA
- #TWTR
- AUDCAD
- AUDCHF
- AUDJPY
- AUDUSD
- EURCAD
- EURCHF
- EURGBP
- EURJPY
- EURNZD
- EURRUB
- EURUSD
- GBPAUD
- GBPCHF
- GBPJPY
- GBPUSD
- GOLD
- NZDCAD
- NZDCHF
- NZDJPY
- NZDUSD
- SILVER
- USDCAD
- USDCHF
- USDJPY
- USDRUB
- All
- M5
- M15
- M30
- H1
- D1
- All
- Buy
- Sale
- All
- 1
- 2
- 3
- 4
- 5
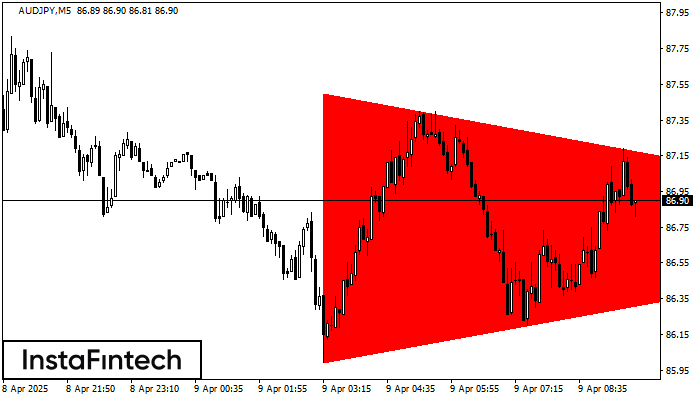
According to the chart of M5, AUDJPY formed the Bearish Symmetrical Triangle pattern. This pattern signals a further downward trend in case the lower border 85.99 is breached. Here
The M5 and M15 time frames may have more false entry points.
Open chart in a new window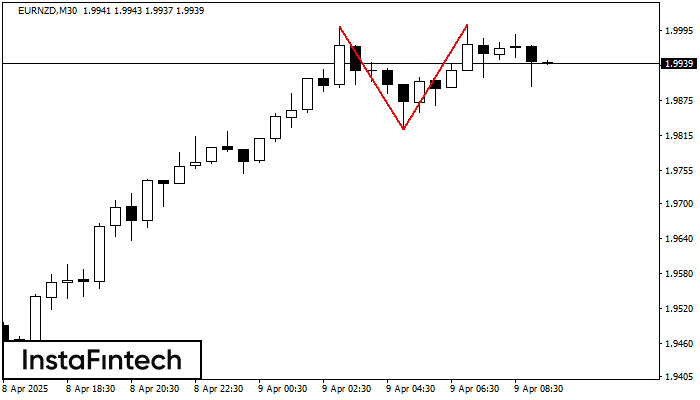
The Double Top pattern has been formed on EURNZD M30. It signals that the trend has been changed from upwards to downwards. Probably, if the base of the pattern 1.9825
Open chart in a new window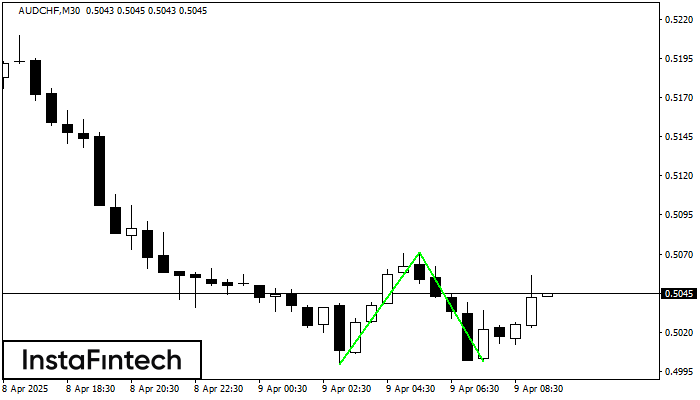
The Double Bottom pattern has been formed on AUDCHF M30; the upper boundary is 0.5071; the lower boundary is 0.5001. The width of the pattern is 72 points. In case
Open chart in a new window


