empty
14.01.2025 01:42 PM
GBP/USD. January 14th. Two Inflations: What Should the Pound Expect?

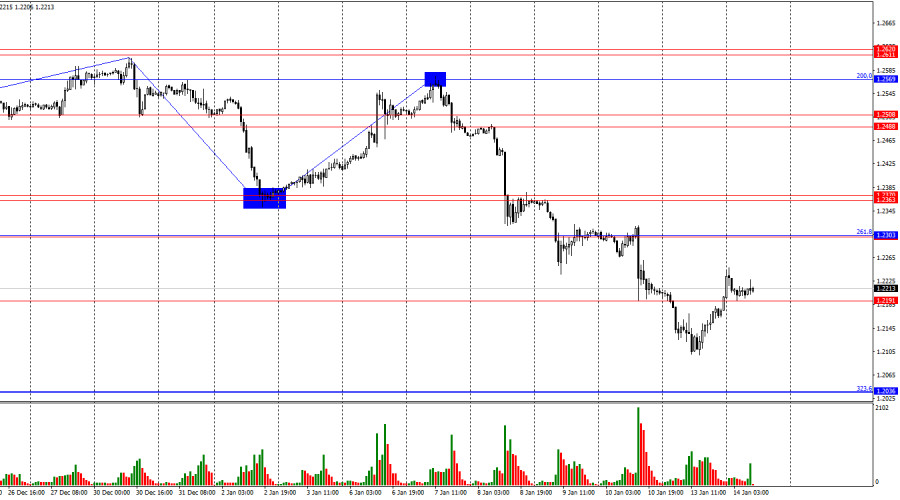
On the hourly chart, the GBP/USD pair continued its decline for half of Monday but then reversed in favor of the pound, rising to the 1.2191 level. Today, consolidation below this level will once again favor the US dollar, resuming the decline toward the 323.6% Fibonacci corrective level at 1.2036. If quotes remain above the 1.2191 level, further growth toward the 261.8% Fibonacci level at 1.2303 cannot be ruled out.

This image is no longer relevant

The wave structure raises no questions. The last completed upward wave did not break the previous wave's peak, while the current downward wave has broken the previous low. Thus, a "bearish" trend is clearly forming, with no signs of its conclusion. To end the trend, the pound would need to rise to at least the 1.2569 level and confidently close above it. Such a development seems unlikely in the near future.

On Monday, there was no significant news, and today traders are likely to focus only on the US Producer Price Index (PPI). However, the market is primarily awaiting tomorrow's inflation reports from both the UK and the US, which are the most critical releases of the week. These reports could either halt the dollar's growth or further fuel it.

Inflation dynamics are currently straightforward. US inflation is rising, as anticipated by traders and the Federal Reserve. The stronger the inflation increase for December, the higher the likelihood of renewed dollar growth, as the FOMC could reduce its planned monetary policy easing in 2025 to one or even zero rate cuts. Conversely, weaker-than-expected inflation could weaken the dollar. The same logic applies to UK inflation. These reports will be released six hours apart tomorrow, meaning the pair's movements may shift directions at different times. By the end of the day, we should have clarity on whether the dollar can continue its growth trajectory.

This image is no longer relevant

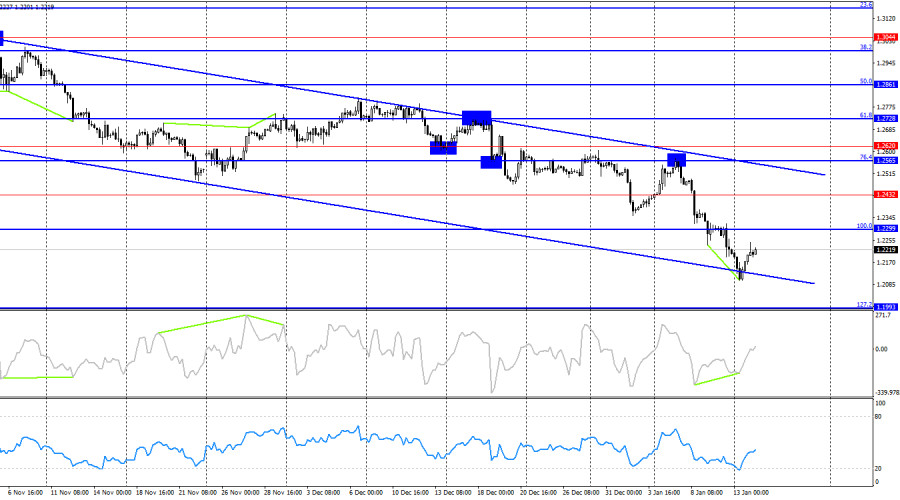
On the 4-hour chart, the pair rebounded from the 76.4% Fibonacci corrective level at 1.2565, consolidated below the 100.0% Fibonacci level at 1.2299, and continues its descent toward the 127.2% Fibonacci corrective level at 1.1993. The downward trend channel indicates bearish dominance, which they are unlikely to relinquish soon. Only a close above the channel would signal a potential strong recovery for the pound. A developing "bearish" divergence on the CCI indicator warns of a possible resumption of the decline.

Commitments of Traders (COT) Report:

This image is no longer relevant

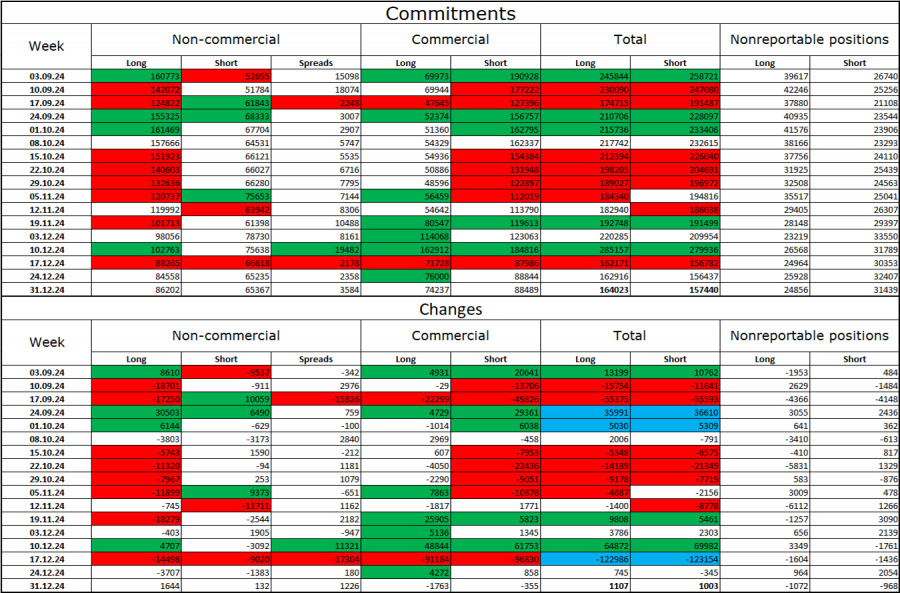
The sentiment of the "Non-commercial" category of traders showed little change in the latest reporting week. The number of long positions held by speculators increased by 1,644, while short positions grew by 132. Bulls still hold an advantage, but it is visibly shrinking. The gap between long and short positions is now only 21,000: 86,000 versus 65,000.

In my view, the pound retains downward potential, and COT reports indicate strengthening bearish positions almost every week. Over the past three months, the number of long positions has decreased from 160,000 to 86,000, while short positions have increased from 52,000 to 65,000. I believe professional players will continue reducing long positions or increasing shorts over time, as all possible factors supporting the pound have already played out. Technical analysis also supports the pound's decline.

Economic Calendar for the US and UK:

  • US – Producer Price Index (PPI) (13:30 UTC).

Tuesday's economic calendar contains only one minor event. The impact of the information background on trader sentiment today will be minimal.

GBP/USD Forecast and Trading Recommendations:

  • Sales: Selling opportunities were present following a rebound from the 1.2569 level on the hourly chart. Sales were also viable after closing below the 1.2488–1.2508 zone and the 1.2303 level. Today, sales are possible upon closing below the 1.2191 level on the hourly chart, targeting 1.2036.
  • Purchases: I do not plan to consider buying opportunities today.

Fibonacci Levels:

  • Hourly chart: Built between 1.3000 and 1.3432.

4-hour chart: Built between 1.2299 and 1.3432.

Samir Klishi,
انسٹافاریکس کا تجزیاتی ماہر
© 2007-2025
ٹائم فریم منتخب کریں
5
منٹ
15
منٹ
30
منٹ
1
گھنٹہ
4
گھنٹے
1
دن
1
ہفتہ
انسٹافاریکس کے ساتھ کرپٹو کرنسی کی معاملاتی تبدیلیوں سے کمائیں۔
میٹا ٹریڈر 4 ڈاؤن لوڈ کریں اور اپنی پہلی ٹریڈ کھولیں۔
  • Grand Choice
    Contest by
    InstaForex
    InstaForex always strives to help you
    fulfill your biggest dreams.
    مقابلہ میں شامل ہوں

تجویز کردہ مضامین

پلاٹینم کموڈٹی انسٹرومنٹ کی انٹرا ڈے پرائس موومنٹ کا تکنیکی تجزیہ، منگل 21 جنوری 2025۔

اس کے 4 گھنٹے کے چارٹ پر پلاٹینم کموڈٹی انسٹرومنٹ ابھی بھی کمزور حالت میں آگے بڑھ رہا ہے جہاں اس کی تصدیق اس کی قیمت کی حرکت سے ہوتی

Arief Makmur 12:12 2025-01-21 UTC+2

یورو / یو ایس ڈی: 20 جنوری۔ ڈالر کے لیے ایک اہم ہفتہ

پیر کو، اقتصادی واقعات کے کیلنڈر میں ایک ہی اندراج شامل ہے، لیکن اس کا امریکی ڈالر پر اہم اثر پڑ سکتا ہے۔ معلومات کا پس منظر بقیہ

Samir Klishi 15:32 2025-01-20 UTC+2

جی بی پی / یو ایس ڈی کی پیشن گوئی برائے 20 جنوری 2025

جمعہ کو، جی بی پی / یو ایس ڈی پئیر نے 1.2191 کی سطح کو مکمل طور پر نظر انداز کرتے ہوئے، گھنٹہ وار چارٹ پر تجارت جاری رکھی۔ چونکہ

Samir Klishi 15:21 2025-01-20 UTC+2

یو ایس ڈی / جے پی وائے اور یورو / جے پی وائے – تکنیکی تجزیہ کا جائزہ

پچھلے ہفتے کے آخر میں، ہم نے ہفتہ وار کنسولیڈیشن کا مشاہدہ کیا، جس کے نتیجے میں 156.07 پر ہفتہ وار اچہی موکو کلاؤڈ کی حدود میں لمبا نچلا سایہ

Evangelos Poulakis 08:56 2025-01-20 UTC+2

Bitcoin – Technical Analysis

Last year, the bulls clearly had the upper hand, achieving significant advantages and accomplishments. In 2024, they reached a new all-time high of $108,362.36, surpassing the previous peak of $68,959.73

Evangelos Poulakis 08:56 2025-01-20 UTC+2

خام تیل کے کمیوڈٹی انسٹرومنٹ کی یومیہ قیمت کی نقل و حرکت کا تکنیکی تجزیہ، پیر 20 جنوری 2025۔

یومیہ چارٹ پر، خام تیل کا کموڈٹی انسٹرومنٹ فیلنگ ویج پیٹرن کو کامیابی کے ساتھ توڑنے کے بعد دیکھا جا سکتا ہے،کروڈ آئل قیمت کی حرکت اور سٹوچاسٹک آسکیلیٹر اشارے

Arief Makmur 08:56 2025-01-20 UTC+2

جنوری 17-21 2025 کے لیے سونے (ایکس اے یو / یو ایس ڈی) کے لیے تجارتی سگنل: $2,725 سے نیچے فروخت (زیادہ خریدی گئی- 6/8 مرے)

ایگل انڈیکیٹر اوور باٹ ہونے کے اشارے دکھا رہا ہے، لہذا ہم اگلے چند دنوں میں فروخت کے مواقع تلاش کریں گے جب تک کہ سونے کی قیمت 6/8

Dimitrios Zappas 15:15 2025-01-17 UTC+2

جنوری 16-19 2025 کے لیے یورو / یو ایس ڈی کے لیے تجارتی سگنل: 1.0290 سے اوپر خریدیں (21 ایس ایم اے - 4/8 مرے)

اہم باخبر رہنا ہے۔ اگر یورو / یو ایس ڈی جوڑا 200 ای ایم اے سے اوپر مضبوط ہونے کا انتظام کرتا ہے، تو ہم رجحان میں تبدیلی کی توقع

Dimitrios Zappas 15:12 2025-01-17 UTC+2

جی بی پی / یو ایس ڈی کی پیشن گوئی برائے 15 جنوری 2025

فی گھنٹہ چارٹ پر، جی بی پی / یو ایس ڈی جوڑا یا تو اپنی اوپر کی حرکت کو بڑھانے میں ناکام رہا یا منگل کو ایک نئی کمی شروع

Samir Klishi 13:51 2025-01-15 UTC+2

یورو / یو ایس ڈی کی پیشن گوئی برائے 15 جنوری 2025

منگل کو، یورو / یو ایس ڈی پئیر 1.0255 پر 127.2% فیبوناچی ریٹریسمنٹ کی سطح سے اوپر مضبوط ہوا اور 1.0336–1.0346 پر مزاحمتی زون کی طرف اپنی اوپر کی حرکت

Samir Klishi 13:13 2025-01-15 UTC+2
ابھی فوری بات نہیں کرسکتے ؟
اپنا سوال پوچھیں بذریعہ چیٹ.
Widget callback