empty
11.02.2025 12:53 PM
EUR/USD – February 11th: Trump Begins a New Dangerous Game

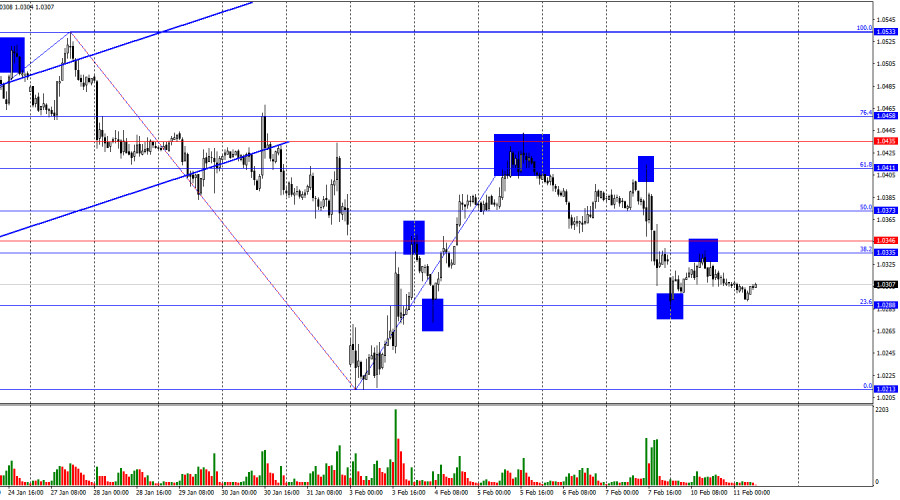
On Monday, the EUR/USD pair rallied towards the 1.0335 – 1.0346 resistance zone, rejected it, and reversed in favor of the U.S. dollar, dropping to the 23.6% Fibonacci retracement level at 1.0288. A rebound from this level would support the euro's recovery, pushing the pair back toward the resistance zone. A confirmed breakout below 1.0288 would open the door for a continued decline toward the 0.0% Fibonacci level at 1.0213.

This image is no longer relevant

On the hourly chart, the wave structure has become unclear. The last completed downward wave broke the previous low. The last completed upward wave failed to break the previous high.

This suggests that the trend has shifted to bearish or that the pair is moving in a complex horizontal consolidation pattern. The inconsistency in wave sizes raises doubts about a clear trend direction.

Although Monday lacked economic data, debates over Trump's trade war strategy remain active. What is Trump trying to achieve with tariffs? The U.S. president aims to bring manufacturing back to the U.S. and reduce the trade deficit. Can tariffs accomplish this goal? China, Mexico, and Canada heavily depend on U.S. exports. Tariffs on these countries could significantly harm their GDP. However, U.S. inflation is also rising, which may force the Fed to keep interest rates high longer—or even raise them. For the dollar, this situation is more likely a good thing than a bad thing, but at the same time, I do not believe that the American economy will grow through trade wars. Mexico and Canada accepted Trump's initial terms, but they may reject his new ultimatums. China hasn't even complied with the first set of U.S. demands.

This image is no longer relevant

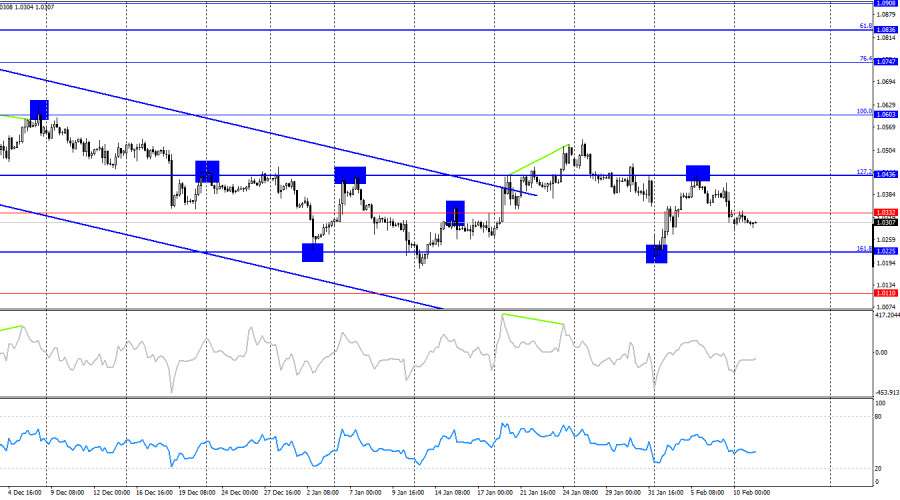
On the H4 Chart, the EUR/USD pair rejected the 127.2% Fibonacci retracement level at 1.0436, leading to a bearish reversal in favor of the U.S. dollar. The pair now has a realistic chance of declining further toward the 161.8% Fibonacci level at 1.0225. For bulls to regain control, they will need a strong fundamental catalyst to break through 1.0436. No divergence signals are currently observed on any indicators.

Commitments of Traders (COT) Report Analysis

This image is no longer relevant

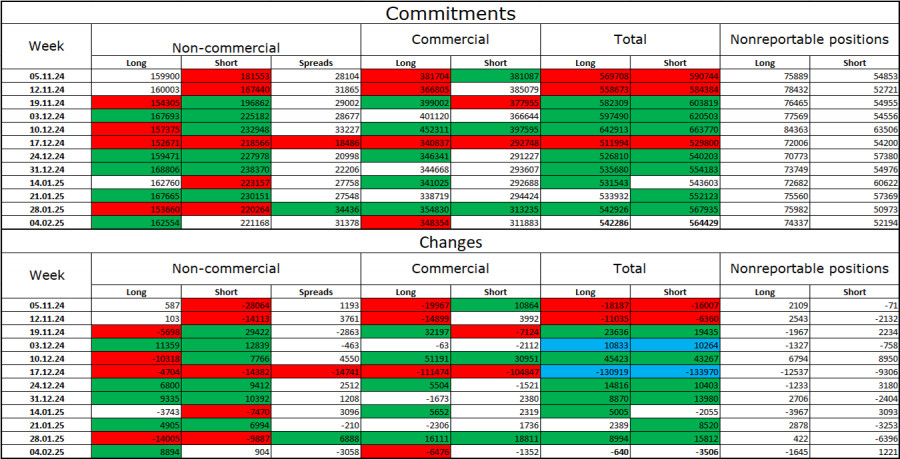
In the latest reporting week, institutional traders opened 8,894 long positions and 904 short positions. The total number of long positions concentrated in the hands of speculators now stands at 162,000, and short positions at 221,000.

For 20 consecutive weeks, institutional traders have been selling the euro—a clear bearish trend. While bulls occasionally dominate for brief periods, this is the exception rather than the rule. The primary bearish driver—the expectation of Fed policy easing—has already been priced in. There are no strong reasons to sell the dollar further. Future catalysts may emerge, but for now, the U.S. dollar is more likely to continue strengthening. Technical analysis also supports a continuation of the long-term bearish trend. I expect EUR/USD to continue declining in the medium term.

Key Economic Events for the U.S. and the Eurozone (February 11)

  • United States – Fed Chair Jerome Powell's Testimony (15:00 UTC).

The economic calendar for February 11 contains only one major event. Powell's speech is expected to have a moderate market impact, likely influencing sentiment in the second half of the trading day.

Trading Recommendations for EUR/USD

Selling the pair was a valid strategy after a rejection from 1.0411 on the hourly chart, with a target of 1.0335 – 1.0346. This target was reached with a strong margin.

On Monday, selling was also valid after rejection from 1.0335 – 1.0346, targeting 1.0288 and 1.0213. The first target (1.0288) has been reached. Buying could be considered near 1.0288, but the trend has turned bearish again.

Fibonacci levels are plotted as follows:

  • 1H Chart: 1.0533 – 1.0213.
  • 4H Chart: 1.0603 – 1.1214.
Samir Klishi,
انسٹافاریکس کا تجزیاتی ماہر
© 2007-2025
ٹائم فریم منتخب کریں
5
منٹ
15
منٹ
30
منٹ
1
گھنٹہ
4
گھنٹے
1
دن
1
ہفتہ
انسٹافاریکس کے ساتھ کرپٹو کرنسی کی معاملاتی تبدیلیوں سے کمائیں۔
میٹا ٹریڈر 4 ڈاؤن لوڈ کریں اور اپنی پہلی ٹریڈ کھولیں۔
  • Grand Choice
    Contest by
    InstaForex
    InstaForex always strives to help you
    fulfill your biggest dreams.
    مقابلہ میں شامل ہوں

تجویز کردہ مضامین

جی بی پی / یو ایس ڈی : سٹرلنگ سپورٹ حاصل کرنا بند کر سکتا ہے۔

جیسا کہ پہلے متعدد مواقع پر ذکر کیا گیا ہے، غیر ملکی کرنسی (فاریکس) مارکیٹ میں امریکی ڈالر کے مقابلے میں تجارت کی جانے والی بڑی کرنسیوں کی طاقت

Pati Gani 15:00 2025-07-03 UTC+2

یو ایس ڈی / جے پی وائے ۔ تجزیہ، پیشن گوئی، اور موجودہ مارکیٹ کی صورتحال

یہ کہ 4 گھنٹے کے چارٹ پر موجود منفی آسکیلیٹر اس بات کی نشاندہی کرتے ہیں کہ مزید اوپر کی حرکت کو فروخت کے موقع کے طور پر دیکھا

Irina Yanina 19:37 2025-07-02 UTC+2

جولائی 2-8 2025 کے لیے سونے (ایکس اے یو / یو ایس ڈی) کے لیے تجارتی اشارہ: 3,325 سے اوپر خریدیں (21 ایس ایم اے - 200 ایس ایم اے)

سونا ایک نئے تیزی کے سلسلے کی تیاری کر رہا ہے، اس لیے قیمت 3,325 یا 3,312 سے اوپر مستحکم ہو جاتی ہے۔ کسی بھی تکنیکی ریباؤنڈ کو خرید سگنل

Dimitrios Zappas 19:26 2025-07-02 UTC+2

جولائی 2-5 2025 کے لیے یورو / یو ایس ڈی کے لیے تجارتی سگنل: 1.1840 سے نیچے فروخت کریں (+1/8 مرے - 21 ایس ایم اے)

اگر یورو 1.1762 سے نیچے ٹوٹ جاتا ہے اور اس پرائس زون سے نیچے مستحکم ہوتا ہے تو، ایک بیئرش ایکسلریشن ممکن ہے۔ لہذا، یورو / یو ایس ڈی 1.1620

Dimitrios Zappas 19:23 2025-07-02 UTC+2

یورو ۔ یو ایس ڈی 30 جون۔ کرسٹین لیگارڈ کی تقریر سے کیا توقع کی جائے؟

جمعہ کو، یورو / یو ایس ڈی پئیر نے اپنی اوپر کی حرکت جاری رکھی۔ 1.1712 پر 127.2% ریٹریسمنٹ لیول نسبتاً کمزور ثابت ہوا۔ تاہم، اس کے اوپر ایک قریب

Samir Klishi 14:20 2025-06-30 UTC+2

جی بی پی / یو ایس ڈی کی پیشن گوئی برائے 30 جون 2025

گھنٹہ وار چارٹ پر، جمعہ کو جی بی پی / یو ایس ڈی جوڑی نے ایک طرف تجارت کی۔ تیزی کے تاجروں نے 1.3749 پر 200.0% ریٹریسمنٹ

Samir Klishi 14:08 2025-06-30 UTC+2

یو ایس ڈی / جے پی وائے تجزیہ، پیشن گوئی اور موجودہ مارکیٹ کی صورتحال

آج، ٹوکیو میں صارفین کی قیمتوں میں کمی کو ظاہر کرنے والے اعداد و شمار کے اجراء کے بعد، جاپانی ین کمزور ہونا شروع ہوا۔ اس خبر سے ان توقعات

Irina Yanina 11:16 2025-06-27 UTC+2

سونا: اس میں کیوں ایک مرتبہ دوبارہ اضافہ ہو رہا ہے

زرد دھات کو ایک بار پھر دو اہم عوامل کی وجہ سے سپورٹ مل رہی ہے۔ پہلا تہران اور تل ابیب کے درمیان مذاکرات کی ناکامی کا مسلسل خطرہ ہے۔

Pati Gani 14:56 2025-06-26 UTC+2

جون 24-25 2025 کے لیے یورو / یو ایس ڈی کے لیے تجارتی سگنل: 1.1620 سے نیچے فروخت کریں (ٹرپل ٹاپ - 8/8 مرے)

ایچ 4 چارٹ ٹرپل ٹاپ فارمیشن پیٹرن دکھاتا ہے۔ اگر یورو کی قیمت 1.1620 سے نیچے آتی ہے، تو سگنل منفی ہو گا، اور ہم 1.1533 پر ہدف کے ساتھ

Dimitrios Zappas 20:25 2025-06-24 UTC+2

جون 24-28 2025 کے لیے سونے (ایکس اے یو / یو ایس ڈی) کے لیے تجارتی سگنل: $3,327 (21 ایس ایم اے - 200 ای ایم اے) سے نیچے فروخت

یہ کہ3,300 کا یہ رقبہ مضبوط سپورٹ کی نمائندگی کرتا ہے، لیکن ہمیں یقین ہے کہ سونا آنے والے گھنٹوں میں 3,327 کی طرف تکنیکی ریباؤنڈ کر سکتا ہے۔

Dimitrios Zappas 20:23 2025-06-24 UTC+2
ابھی فوری بات نہیں کرسکتے ؟
اپنا سوال پوچھیں بذریعہ چیٹ.
Widget callback
 

Dear visitor,

Your IP address shows that you are currently located in the USA. If you are a resident of the United States, you are prohibited from using the services of InstaFintech Group including online trading, online transfers, deposit/withdrawal of funds, etc.

If you think you are seeing this message by mistake and your location is not the US, kindly proceed to the website. Otherwise, you must leave the website in order to comply with government restrictions.

Why does your IP address show your location as the USA?

  • - you are using a VPN provided by a hosting company based in the United States;
  • - your IP does not have proper WHOIS records;
  • - an error occurred in the WHOIS geolocation database.

Please confirm whether you are a US resident or not by clicking the relevant button below. If you choose the wrong option, being a US resident, you will not be able to open an account with InstaForex anyway.

We are sorry for any inconvenience caused by this message.