


signal strength 1 of 5
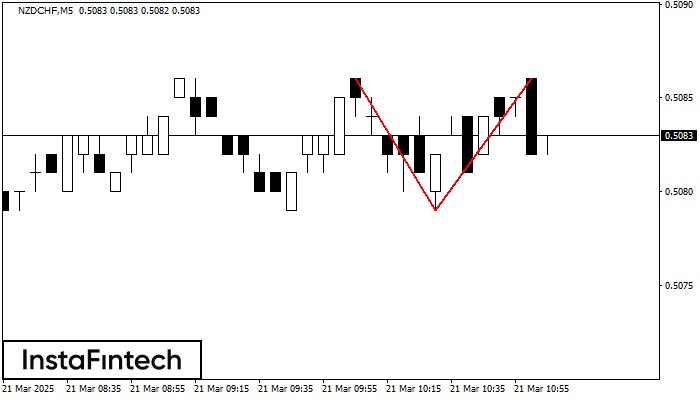
On the chart of NZDCHF M5 the Double Top reversal pattern has been formed. Characteristics: the upper boundary 0.5086; the lower boundary 0.5079; the width of the pattern 7 points. The signal: a break of the lower boundary will cause continuation of the downward trend targeting the 0.5064 level.
The M5 and M15 time frames may have more false entry points.
- All
- Double Top
- Flag
- Head and Shoulders
- Pennant
- Rectangle
- Triangle
- Triple top
- All
- #AAPL
- #AMZN
- #Bitcoin
- #EBAY
- #FB
- #GOOG
- #INTC
- #KO
- #MA
- #MCD
- #MSFT
- #NTDOY
- #PEP
- #TSLA
- #TWTR
- AUDCAD
- AUDCHF
- AUDJPY
- AUDUSD
- EURCAD
- EURCHF
- EURGBP
- EURJPY
- EURNZD
- EURRUB
- EURUSD
- GBPAUD
- GBPCHF
- GBPJPY
- GBPUSD
- GOLD
- NZDCAD
- NZDCHF
- NZDJPY
- NZDUSD
- SILVER
- USDCAD
- USDCHF
- USDJPY
- USDRUB
- All
- M5
- M15
- M30
- H1
- D1
- All
- Buy
- Sale
- All
- 1
- 2
- 3
- 4
- 5
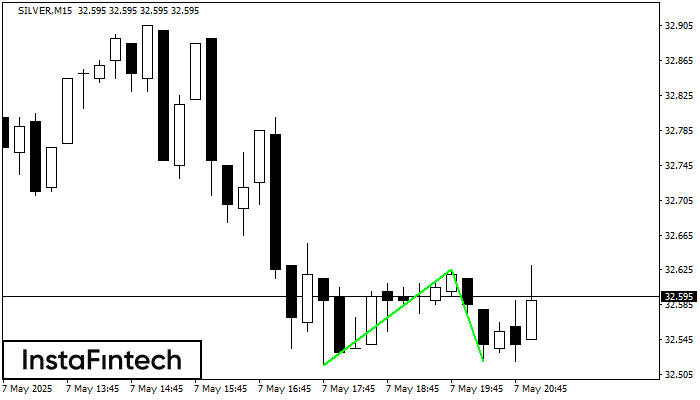
M15 চার্টে, SILVER-এর ডাবল বটম প্যাটার্নটি গঠিত হয়েছে। এই প্যাটার্নের গঠন এই সংকেত প্রদান করে যে মূল্য বিপরীতমুখী হয়ে নিম্নমুখী থেকে ঊর্ধ্বমুখী প্রবণতা প্রদর্শন করবে। এই প্যাটার্নের উপরের সীমানা 32.62
M5 এবং M15 টাইম ফ্রেমে আরও ভুল এন্ট্রি পয়েন্ট থাকতে পারে।
Open chart in a new window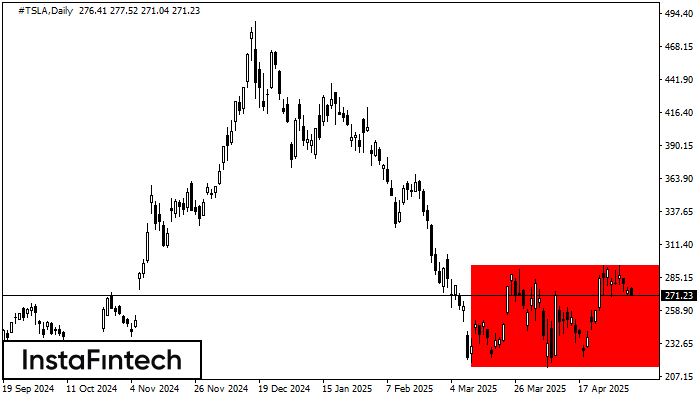
D1 চার্ট অনুযায়ী, #TSLA বিয়ারিশ রেক্ট্যাঙ্গেল গঠন করেছে। এই প্যাটার্ন চলমান প্রবণতার ধারাবাহিকতা নির্দেশ করে। এটি দুটি স্তর নিয়ে গঠিত: 294.59 - 0.00-এর রেজিস্ট্যান্স এবং 214.10 - 214.10-এর সাপোর্ট৷ 214.10
Open chart in a new window
D1 চার্ট অনুসারে, #TSLA বিয়ারিশ রেক্ট্যাঙ্গেল গঠন করেছে যা চলমান প্রবণতার ধারাবাহিকতার প্যাটার্ন। প্যাটার্নটি নিম্নলিখিত সীমানার মধ্যে রয়েছে: নীচের সীমানা 214.10 – 214.10 এবং উপরের সীমানা 294.59 – 294.59৷ নীচের
Open chart in a new window


