


signal strength 2 of 5
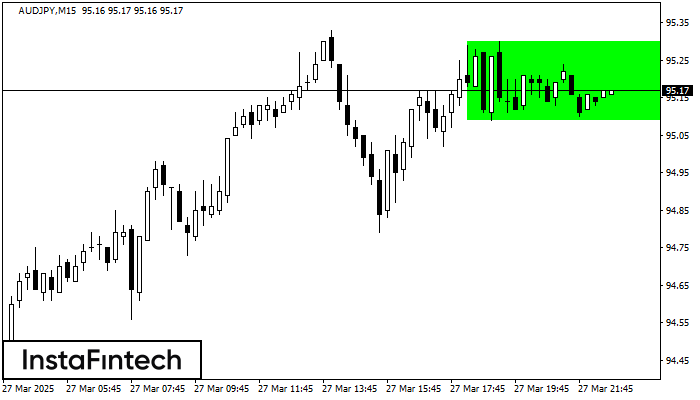
According to the chart of M15, AUDJPY formed the Bullish Rectangle. The pattern indicates a trend continuation. The upper border is 95.30, the lower border is 95.09. The signal means that a long position should be opened above the upper border 95.30 of the Bullish Rectangle.
The M5 and M15 time frames may have more false entry points.
یہ بھی دیکھیں
- All
- Double Top
- Flag
- Head and Shoulders
- Pennant
- Rectangle
- Triangle
- Triple top
- All
- #AAPL
- #AMZN
- #Bitcoin
- #EBAY
- #FB
- #GOOG
- #INTC
- #KO
- #MA
- #MCD
- #MSFT
- #NTDOY
- #PEP
- #TSLA
- #TWTR
- AUDCAD
- AUDCHF
- AUDJPY
- AUDUSD
- EURCAD
- EURCHF
- EURGBP
- EURJPY
- EURNZD
- EURRUB
- EURUSD
- GBPAUD
- GBPCHF
- GBPJPY
- GBPUSD
- GOLD
- NZDCAD
- NZDCHF
- NZDJPY
- NZDUSD
- SILVER
- USDCAD
- USDCHF
- USDJPY
- USDRUB
- All
- M5
- M15
- M30
- H1
- D1
- All
- Buy
- Sale
- All
- 1
- 2
- 3
- 4
- 5

Berdasarkan carta M5, GBPJPY telah membentuk Segi Empat Menaik. Corak ini menunjukkan kesinambungan aliran. Sempadan atas adalah 193.44, sempadan bawah adalah 193.24. Isyarat bermakna bahawa kedudukan panjang perlu dibuka
Carta masa M5 dan M15 mungkin mempunyai lebih banyak titik kemasukan palsu.
Open chart in a new window
Corak Triple Bottom telah dibentuk pada carta bagi instrumen dagangan EURNZD M5. Corak menandakan perubahan aliran dari menurun ke aliran menaik dalam sekiranya penembusan 1.9038/1.9031
Carta masa M5 dan M15 mungkin mempunyai lebih banyak titik kemasukan palsu.
Open chart in a new window
Corak pembalikan Double Top telah dibentuk pada #Bitcoin M5. Ciri-ciri: sempadan atas %P0.000000; sempadan bawah 103337.20; sempadan bawah 102845.36; lebar corak adalah 51954 mata. Dagangan menjual adalah lebih baik untuk
Carta masa M5 dan M15 mungkin mempunyai lebih banyak titik kemasukan palsu.
Open chart in a new window


