

signal strength 1 of 5
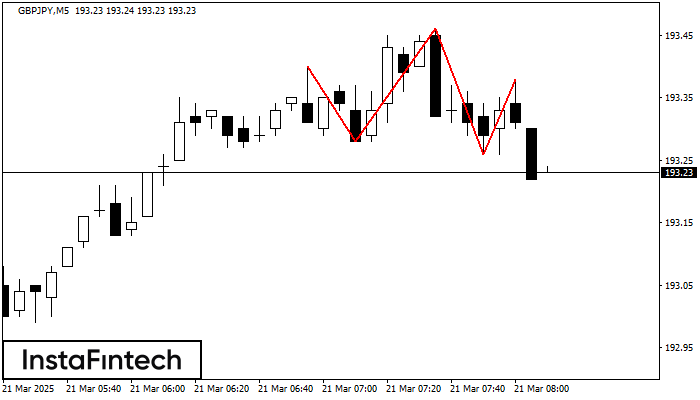
The technical pattern called Head and Shoulders has appeared on the chart of GBPJPY M5. There are weighty reasons to suggest that the price will surpass the Neckline 193.28/193.26 after the right shoulder has been formed. So, the trend is set to change with the price heading for 193.11.
The M5 and M15 time frames may have more false entry points.
See Also
- All
- Double Top
- Flag
- Head and Shoulders
- Pennant
- Rectangle
- Triangle
- Triple top
- All
- #AAPL
- #AMZN
- #Bitcoin
- #EBAY
- #FB
- #GOOG
- #INTC
- #KO
- #MA
- #MCD
- #MSFT
- #NTDOY
- #PEP
- #TSLA
- #TWTR
- AUDCAD
- AUDCHF
- AUDJPY
- AUDUSD
- EURCAD
- EURCHF
- EURGBP
- EURJPY
- EURNZD
- EURRUB
- EURUSD
- GBPAUD
- GBPCHF
- GBPJPY
- GBPUSD
- GOLD
- NZDCAD
- NZDCHF
- NZDJPY
- NZDUSD
- SILVER
- USDCAD
- USDCHF
- USDJPY
- USDRUB
- All
- M5
- M15
- M30
- H1
- D1
- All
- Buy
- Sale
- All
- 1
- 2
- 3
- 4
- 5
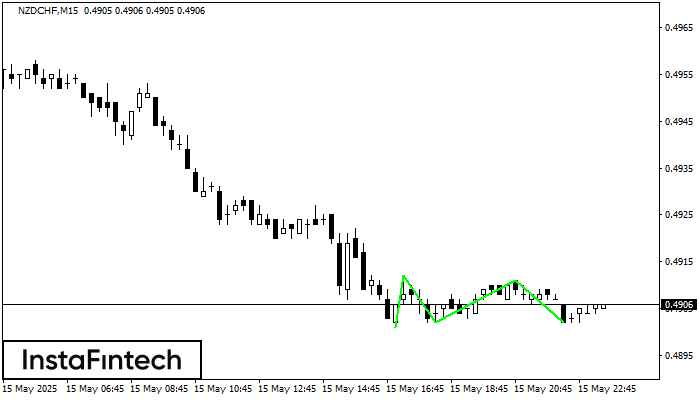
По торговому инструменту NZDCHF на M15 была сформирована графическая фигура «Тройное дно» с характеристиками: Уровень сопротивления 0.4911; Уровень поддержки 0.4902; Ширина 9 пунктов. В случае пробоя уровня сопротивления 0.4912 котировка
Таймфреймы М5 и М15 могут иметь больше ложных точек входа.
Открыть график инструмента в новом окне
По #TSLA на M15 сформировалась фигура «Бычий симметричный треугольник». Нижняя граница фигуры имеет координаты 332.24/342.17, при этом верхняя граница 349.71/342.17. Формирование фигуры «Бычий симметричный треугольник» наиболее вероятным образом свидетельствует
Таймфреймы М5 и М15 могут иметь больше ложных точек входа.
Открыть график инструмента в новом окне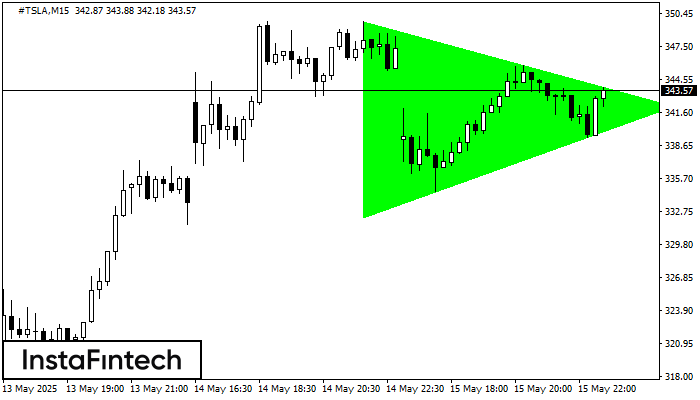
По #TSLA на M15 сформировалась фигура «Бычий симметричный треугольник». Нижняя граница фигуры имеет координаты 332.24/342.17, при этом верхняя граница 349.71/342.17. Формирование фигуры «Бычий симметричный треугольник» наиболее вероятным образом свидетельствует
Таймфреймы М5 и М15 могут иметь больше ложных точек входа.
Открыть график инструмента в новом окне


