


signal strength 1 of 5
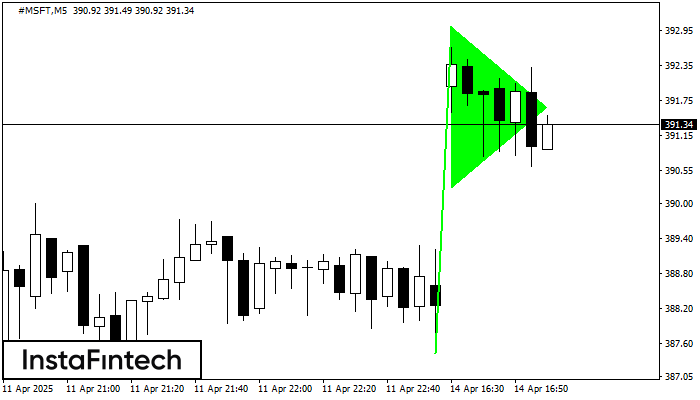
The Bullish pennant pattern is formed on the #MSFT M5 chart. It is a type of the continuation pattern. Supposedly, in case the price is fixed above the pennant’s high of 393.01, a further uptrend is possible.
The M5 and M15 time frames may have more false entry points.
- All
- Double Top
- Flag
- Head and Shoulders
- Pennant
- Rectangle
- Triangle
- Triple top
- All
- #AAPL
- #AMZN
- #Bitcoin
- #EBAY
- #FB
- #GOOG
- #INTC
- #KO
- #MA
- #MCD
- #MSFT
- #NTDOY
- #PEP
- #TSLA
- #TWTR
- AUDCAD
- AUDCHF
- AUDJPY
- AUDUSD
- EURCAD
- EURCHF
- EURGBP
- EURJPY
- EURNZD
- EURRUB
- EURUSD
- GBPAUD
- GBPCHF
- GBPJPY
- GBPUSD
- GOLD
- NZDCAD
- NZDCHF
- NZDJPY
- NZDUSD
- SILVER
- USDCAD
- USDCHF
- USDJPY
- USDRUB
- All
- M5
- M15
- M30
- H1
- D1
- All
- Buy
- Sale
- All
- 1
- 2
- 3
- 4
- 5
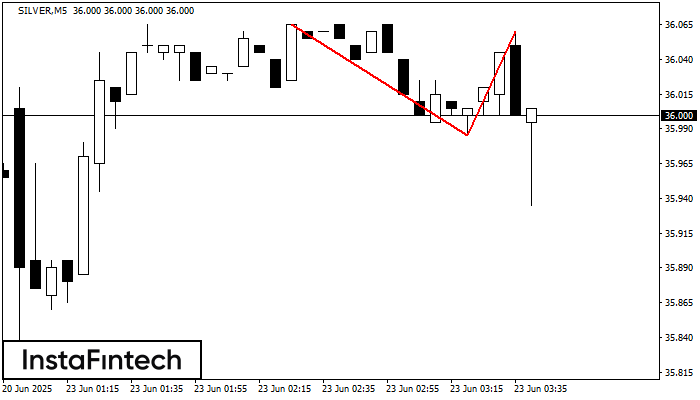
The Double Top reversal pattern has been formed on SILVER M5. Characteristics: the upper boundary 36.06; the lower boundary 35.98; the width of the pattern is 75 points. Sell trades
The M5 and M15 time frames may have more false entry points.
Open chart in a new window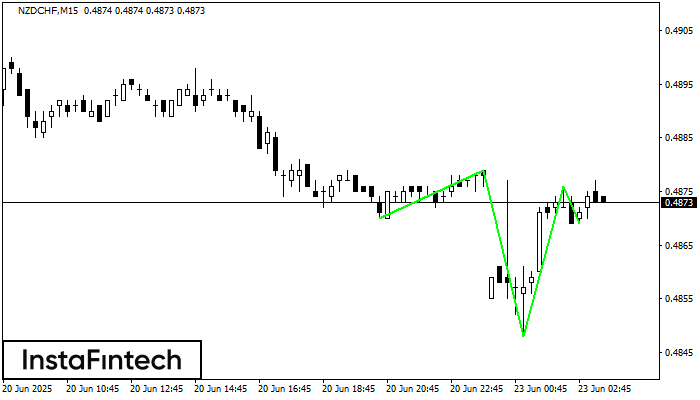
According to the chart of M15, NZDCHF formed the Inverse Head and Shoulder pattern. The Head’s top is set at 0.4876 while the median line of the Neck is found
The M5 and M15 time frames may have more false entry points.
Open chart in a new window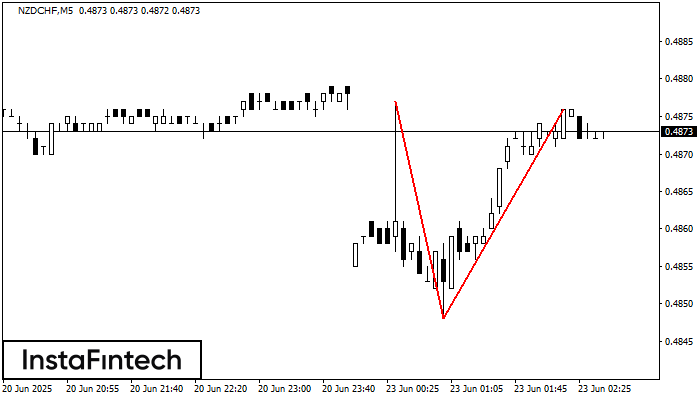
The Double Top pattern has been formed on NZDCHF M5. It signals that the trend has been changed from upwards to downwards. Probably, if the base of the pattern 0.4848
The M5 and M15 time frames may have more false entry points.
Open chart in a new window


