empty
15.08.2022 09:23 AM
Technical analysis of EUR/USD for August 15-20, 2022

Trend analysis

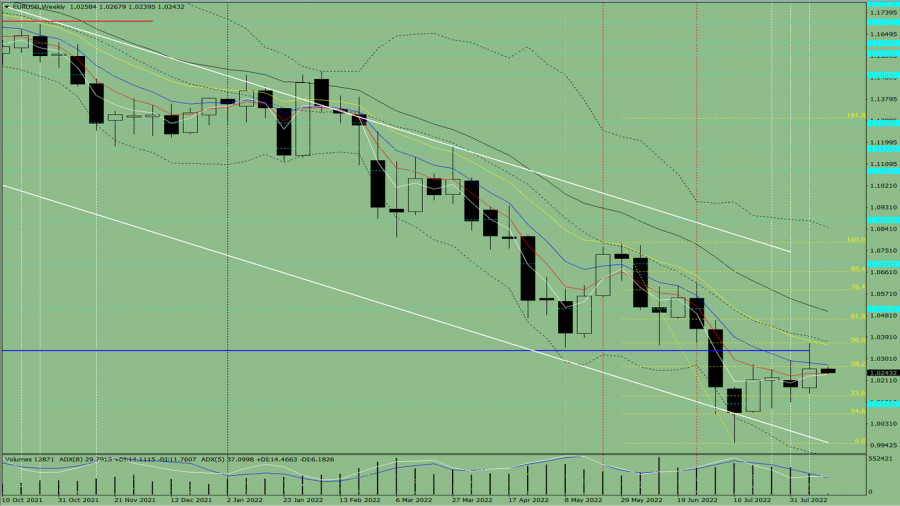
EUR/USD will increase this week, starting from 1.0259 (closing of the last weekly candle) to 1.0368, which is the 50.0% retracement level (yellow dotted line). Then, it will continue moving up to the 61.8% retracement level at 1.0466 (yellow dotted line), before returning to 1.0273, which is the 13 EMA (yellow thin line). Quotes are likely to resume rising after these movements.

This image is no longer relevant

Fig. 1 (weekly chart)

Comprehensive analysis:

Indicator analysis - uptrend

Fibonacci levels - uptrend

Volumes - uptrend

Candlestick analysis - uptrend

Trend analysis - uptrend

Bollinger bands - uptrend

Monthly chart - uptrend

All this points to an upward movement in EUR/USD.

Conclusion: The pair will have an upward trend, with no first lower shadow on the weekly white candle (Monday - up) and no second upper shadow (Friday - up).

During the week, euro will climb from 1.0259 (closing of the last weekly candle) to the 50.0% retracement level at 1.0368 (yellow dotted line), go to the 61.8% retracement level at 1.0466 (yellow dotted line), and bounce back to the 13 EMA at 1.0273 (yellow thin line). Quotes are likely to resume rising after these movements.

Alternatively, the pair could dip from 1.0259 (closing of the last weekly candle) to the historical support level of 1.0114 (dashed blue line), then go up to the resistance line at 1.0335 (thick blue line).

Stefan Doll,
Especialista em análise na InstaForex
© 2007-2025
Summary
Urgency
Analytic
Sergey Belyaev
Start trade
Ganhe com as variações das taxas das criptomoedas com a InstaForex.
Baixe o MetaTrader 4 e abra a sua primeira operação.
  • Grand Choice
    Contest by
    InstaForex
    InstaForex always strives to help you
    fulfill your biggest dreams.
    PARTICIPE DO CONCURSO

Recommended Stories

Previsão para o GBP/USD em 17 de julho de 2025

Uma nuance interessante no comportamento recente da libra esterlina é que ela iniciou uma correção após reagir preliminarmente ao nível de suporte em 1,3369, que não havia sido alcançado

Laurie Bailey 15:35 2025-07-17 UTC+2

Previsão para o USD/JPY em 17 de julho de 2025

Ontem, o par USD/JPY não conseguiu se consolidar acima do nível-alvo de 148,66, mas, na manhã de hoje, está tentando novamente. Uma consolidação bem-sucedida acima desse patamar abriria caminho para

Laurie Bailey 15:28 2025-07-17 UTC+2

Previsão para a prata em 17 de julho de 2025

O aumento de 0,54% na prata ontem interrompeu a queda dos dois dias anteriores. O oscilador Marlin em escala diária permaneceu em território positivo e agora está pronto para apoiar

Laurie Bailey 15:23 2025-07-17 UTC+2

Sinais de negociação para o BITCOIN para 17-21 de julho de 2025: compre acima de 118.750 (EMA 200 - 6/8 de Murray)

Se o preço do Bitcoin cair abaixo do nível 5/8 de Murray em US$ 115.625, a mínima de 14 de julho, podemos esperar que ele alcance a EMA 200, localizada

Dimitrios Zappas 15:19 2025-07-17 UTC+2

Sinais de negociação para o OURO (XAU/USD) para 17-21 de julho de 2025: compre acima de US$ 3.329 (EMA 200 - 5/8 de Murray)

É provável que o ouro continue a subir nos próximos dias e possa atingir o nível 7/8 de Murray em 3.398, que coincide com o topo do canal de tendência

Dimitrios Zappas 15:16 2025-07-17 UTC+2

Expectativas de queda no mercado de ações sob a ótica da taxa de câmbio cruzada EUR/JPY

Historicamente, a fuga de investidores do mercado de ações tende a se refletir inevitavelmente em uma queda do par EUR/JPY, já que essa movimentação representa a saída de moedas

Laurie Bailey 15:11 2025-07-17 UTC+2

O DXY tem potencial para testar seu nível pivô, mas há potencial para um fortalecimento adicional na quinta-feira, 17 de julho de 2025

Índice do Dólar Americano – Quinta-feira, 17 de julho de 2025 Se os níveis de pivô e suporte conseguirem resistir à correção de enfraquecimento do #USDX no curto prazo

Arief Makmur 15:04 2025-07-17 UTC+2

GBP/USD. Análise do indicador em 17 de julho

Na quarta-feira, o par subiu (com base nas notícias), atingindo a EMA de 8 períodos em 1,3489 (linha azul fina), depois caiu e fechou a vela diária em 1,3417. Hoje

Stefan Doll 14:17 2025-07-17 UTC+2

EUR/USD. Análise dos indicadores em 17 de julho

Na quarta-feira, o par subiu (com base nas notícias), atingindo o nível de 23,6% em 1,1739 (linha tracejada amarela), e depois caiu, fechando a vela diária em 1,1639. Hoje

Stefan Doll 14:11 2025-07-17 UTC+2

Previsão para o EUR/USD para 16 de julho de 2025

Os dados de inflação dos E.U.A. divulgados ontem fortaleceram o dólar (índice U6) em 0,56%. O IPC de junho subiu de 2,4% ao ano para 2,7% ao ano, enquanto

Laurie Bailey 20:38 2025-07-16 UTC+2
Não pode falar agora?
Faça sua pergunta no chat.
Widget callback
 

Dear visitor,

Your IP address shows that you are currently located in the USA. If you are a resident of the United States, you are prohibited from using the services of InstaFintech Group including online trading, online transfers, deposit/withdrawal of funds, etc.

If you think you are seeing this message by mistake and your location is not the US, kindly proceed to the website. Otherwise, you must leave the website in order to comply with government restrictions.

Why does your IP address show your location as the USA?

  • - you are using a VPN provided by a hosting company based in the United States;
  • - your IP does not have proper WHOIS records;
  • - an error occurred in the WHOIS geolocation database.

Please confirm whether you are a US resident or not by clicking the relevant button below. If you choose the wrong option, being a US resident, you will not be able to open an account with InstaForex anyway.

We are sorry for any inconvenience caused by this message.