

signal strength 1 of 5
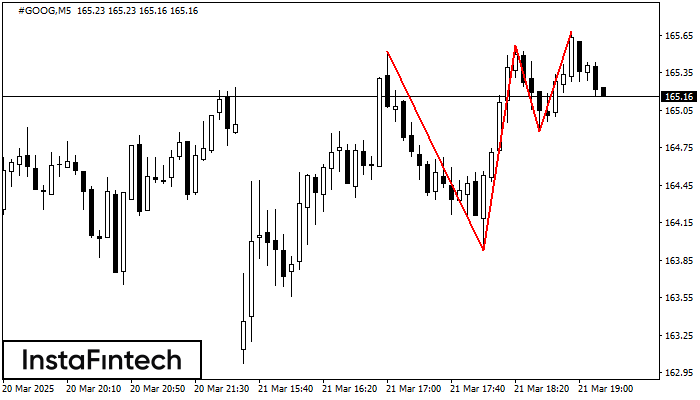
The Triple Top pattern has formed on the chart of the #GOOG M5 trading instrument. It is a reversal pattern featuring the following characteristics: resistance level -16, support level -95, and pattern’s width 159. Forecast If the price breaks through the support level 163.93, it is likely to move further down to 165.42.
The M5 and M15 time frames may have more false entry points.
Veja também
- All
- Double Top
- Flag
- Head and Shoulders
- Pennant
- Rectangle
- Triangle
- Triple top
- All
- #AAPL
- #AMZN
- #Bitcoin
- #EBAY
- #FB
- #GOOG
- #INTC
- #KO
- #MA
- #MCD
- #MSFT
- #NTDOY
- #PEP
- #TSLA
- #TWTR
- AUDCAD
- AUDCHF
- AUDJPY
- AUDUSD
- EURCAD
- EURCHF
- EURGBP
- EURJPY
- EURNZD
- EURRUB
- EURUSD
- GBPAUD
- GBPCHF
- GBPJPY
- GBPUSD
- GOLD
- NZDCAD
- NZDCHF
- NZDJPY
- NZDUSD
- SILVER
- USDCAD
- USDCHF
- USDJPY
- USDRUB
- All
- M5
- M15
- M30
- H1
- D1
- All
- Buy
- Sale
- All
- 1
- 2
- 3
- 4
- 5
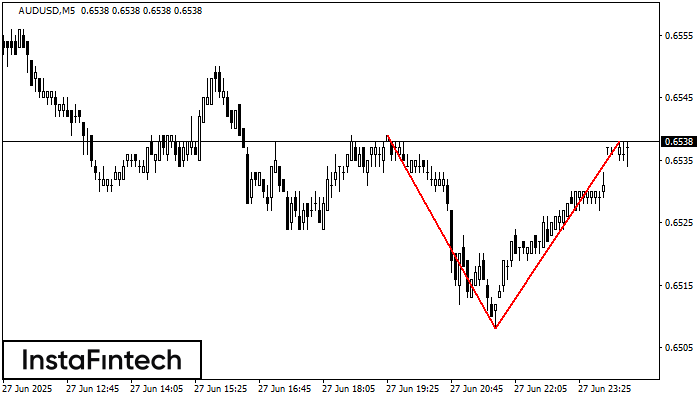
On the chart of AUDUSD M5 the Double Top reversal pattern has been formed. Characteristics: the upper boundary 0.6538; the lower boundary 0.6508; the width of the pattern 30 points
The M5 and M15 time frames may have more false entry points.
Open chart in a new window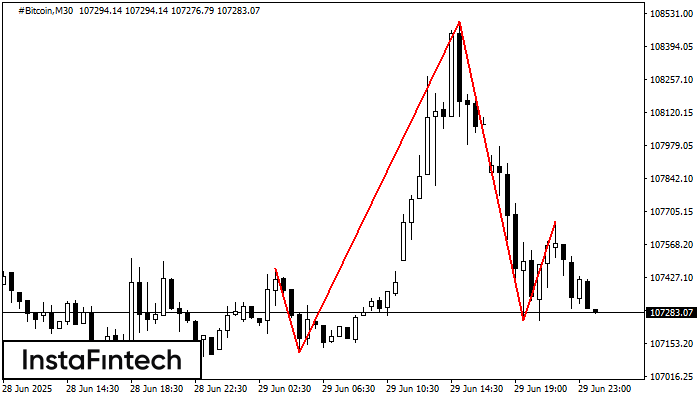
The #Bitcoin M30 formed the Head and Shoulders pattern with the following features: The Head’s top is at 108499.13, the Neckline and the upward angle are at 107112.85/107248.11. The formation
Open chart in a new window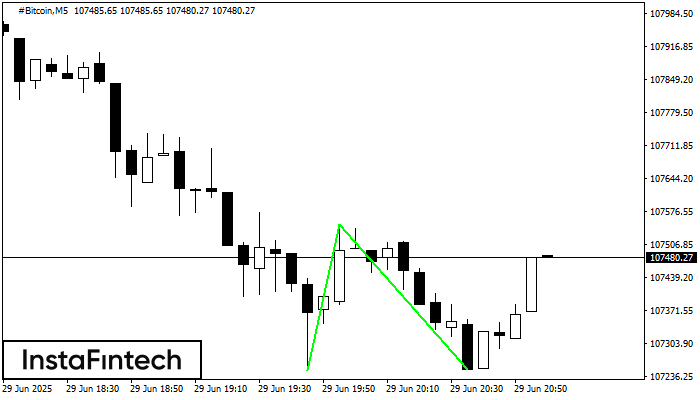
The Double Bottom pattern has been formed on #Bitcoin M5. Characteristics: the support level 107248.11; the resistance level 107549.35; the width of the pattern 30124 points. If the resistance level
The M5 and M15 time frames may have more false entry points.
Open chart in a new window


