


signal strength 2 of 5
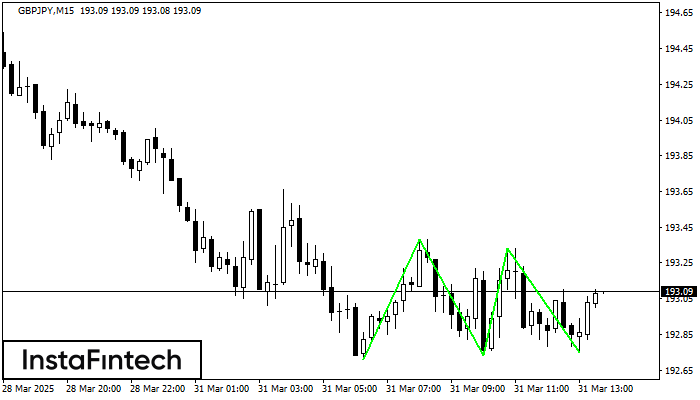
The Triple Bottom pattern has formed on the chart of the GBPJPY M15 trading instrument. The pattern signals a change in the trend from downwards to upwards in the case of breakdown of 193.38/193.33.
The M5 and M15 time frames may have more false entry points.
Veja também
- All
- Double Top
- Flag
- Head and Shoulders
- Pennant
- Rectangle
- Triangle
- Triple top
- All
- #AAPL
- #AMZN
- #Bitcoin
- #EBAY
- #FB
- #GOOG
- #INTC
- #KO
- #MA
- #MCD
- #MSFT
- #NTDOY
- #PEP
- #TSLA
- #TWTR
- AUDCAD
- AUDCHF
- AUDJPY
- AUDUSD
- EURCAD
- EURCHF
- EURGBP
- EURJPY
- EURNZD
- EURRUB
- EURUSD
- GBPAUD
- GBPCHF
- GBPJPY
- GBPUSD
- GOLD
- NZDCAD
- NZDCHF
- NZDJPY
- NZDUSD
- SILVER
- USDCAD
- USDCHF
- USDJPY
- USDRUB
- All
- M5
- M15
- M30
- H1
- D1
- All
- Buy
- Sale
- All
- 1
- 2
- 3
- 4
- 5
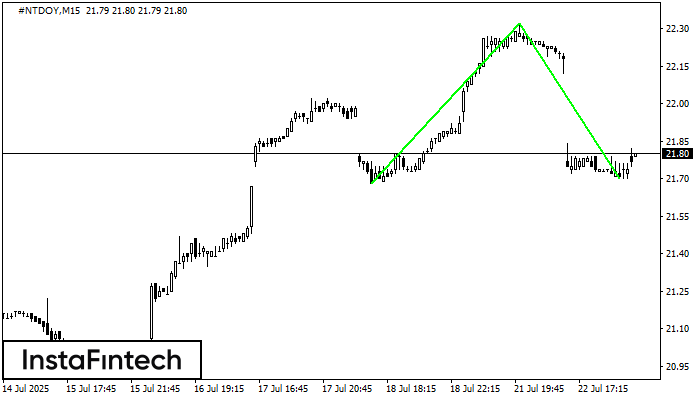
O padrão Fundo duplo foi formado em #NTDOY M15; o limite superior é 22.32; o limite inferior é 21.70. A largura do padrão é de 64 pontos. No caso
Os intervalos M5 e M15 podem ter mais pontos de entrada falsos.
Open chart in a new window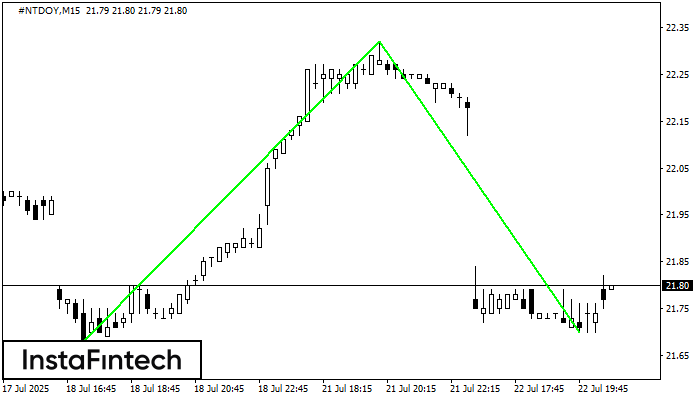
O padrão Fundo duplo foi formado em #NTDOY M15. Características: o nível de suporte 21.68; o nível de resistência 22.32; a largura do padrão 64 pontos. Se o nível
Os intervalos M5 e M15 podem ter mais pontos de entrada falsos.
Open chart in a new window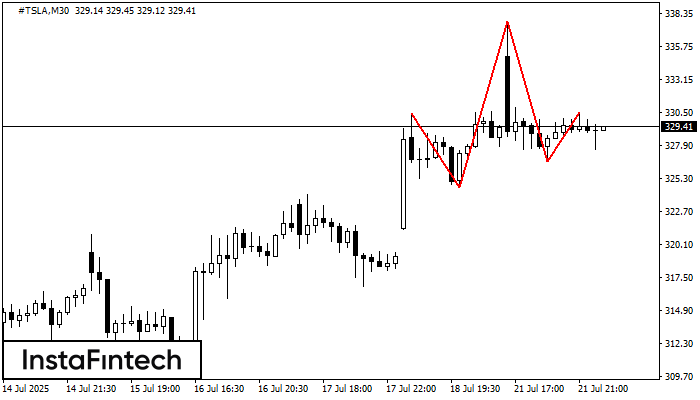
Os #TSLA M30 formaram o padrão Cabeça & Ombros com as seguintes características: O topo da cabeça está em 337.71, a linha do pescoço e o ângulo para cima estão
Open chart in a new window


