

signal strength 2 of 5

The Bearish pennant pattern has formed on the #AAPL M15 chart. It signals potential continuation of the existing trend. Specifications: the pattern’s bottom has the coordinate of 216.06; the projection of the flagpole height is equal to 323 pips. In case the price breaks out the pattern’s bottom of 216.06, the downtrend is expected to continue for further level 215.84.
The M5 and M15 time frames may have more false entry points.
Veja também
- All
- Double Top
- Flag
- Head and Shoulders
- Pennant
- Rectangle
- Triangle
- Triple top
- All
- #AAPL
- #AMZN
- #Bitcoin
- #EBAY
- #FB
- #GOOG
- #INTC
- #KO
- #MA
- #MCD
- #MSFT
- #NTDOY
- #PEP
- #TSLA
- #TWTR
- AUDCAD
- AUDCHF
- AUDJPY
- AUDUSD
- EURCAD
- EURCHF
- EURGBP
- EURJPY
- EURNZD
- EURRUB
- EURUSD
- GBPAUD
- GBPCHF
- GBPJPY
- GBPUSD
- GOLD
- NZDCAD
- NZDCHF
- NZDJPY
- NZDUSD
- SILVER
- USDCAD
- USDCHF
- USDJPY
- USDRUB
- All
- M5
- M15
- M30
- H1
- D1
- All
- Buy
- Sale
- All
- 1
- 2
- 3
- 4
- 5
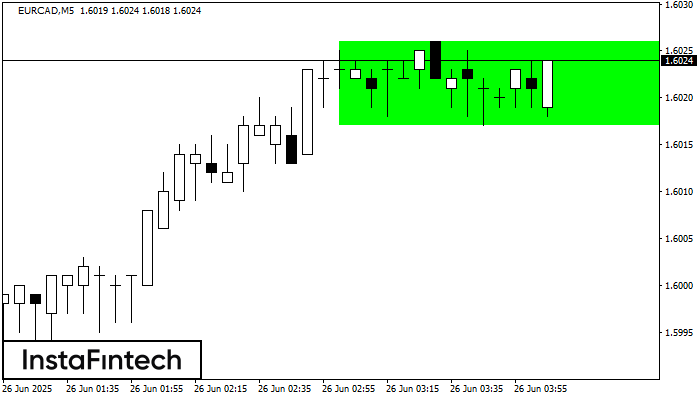
De acordo com o gráfico de M5, EURCAD formou Retângulo de alta. O padrão indica uma continuação da tendência. O limite superior é 1.6026, o limite inferior é 1.6017
Os intervalos M5 e M15 podem ter mais pontos de entrada falsos.
Open chart in a new window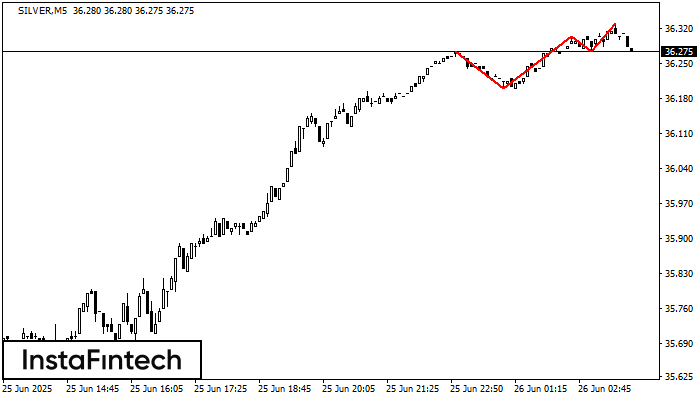
No gráfico do instrumento de negociação SILVER M5, o padrão Topo triplo que sinaliza uma mudança de tendência se formou. É possível que após a formação do terceiro pico
Os intervalos M5 e M15 podem ter mais pontos de entrada falsos.
Open chart in a new window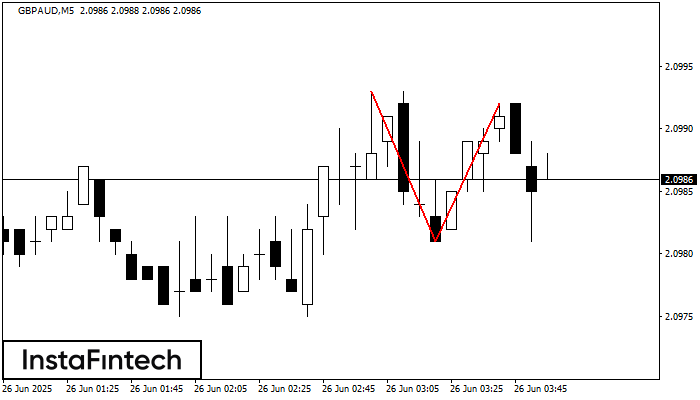
No gráfico de GBPAUD M5 o padrão de reversão Topo duplo foi formado. Características: o limite superior 2.0992; o limite inferior 2.0981; a largura do padrão 11 pontos. O sinal
Os intervalos M5 e M15 podem ter mais pontos de entrada falsos.
Open chart in a new window


