

signal strength 4 of 5

The Triple Top pattern has formed on the chart of the EURJPY H1. Features of the pattern: borders have an ascending angle; the lower line of the pattern has the coordinates 161.49/162.07 with the upper limit 163.10/163.14; the projection of the width is 161 points. The formation of the Triple Top figure most likely indicates a change in the trend from upward to downward. This means that in the event of a breakdown of the support level of 161.49, the price is most likely to continue the downward movement.
Veja também
- All
- Double Top
- Flag
- Head and Shoulders
- Pennant
- Rectangle
- Triangle
- Triple top
- All
- #AAPL
- #AMZN
- #Bitcoin
- #EBAY
- #FB
- #GOOG
- #INTC
- #KO
- #MA
- #MCD
- #MSFT
- #NTDOY
- #PEP
- #TSLA
- #TWTR
- AUDCAD
- AUDCHF
- AUDJPY
- AUDUSD
- EURCAD
- EURCHF
- EURGBP
- EURJPY
- EURNZD
- EURRUB
- EURUSD
- GBPAUD
- GBPCHF
- GBPJPY
- GBPUSD
- GOLD
- NZDCAD
- NZDCHF
- NZDJPY
- NZDUSD
- SILVER
- USDCAD
- USDCHF
- USDJPY
- USDRUB
- All
- M5
- M15
- M30
- H1
- D1
- All
- Buy
- Sale
- All
- 1
- 2
- 3
- 4
- 5
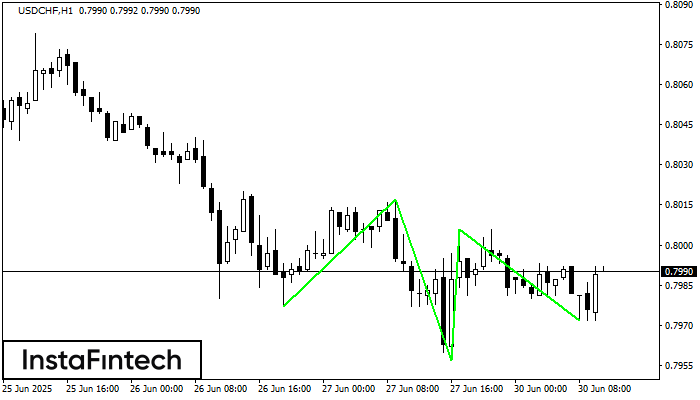
According to the chart of H1, USDCHF produced the pattern termed the Inverse Head and Shoulder. The Head is fixed at 0.7957 while the median line of the Neck
Открыть график инструмента в новом окне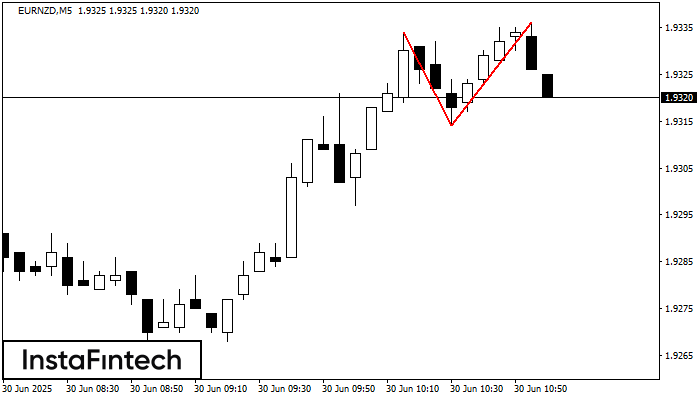
The Double Top reversal pattern has been formed on EURNZD M5. Characteristics: the upper boundary 1.9334; the lower boundary 1.9314; the width of the pattern is 22 points. Sell trades
The M5 and M15 time frames may have more false entry points.
Открыть график инструмента в новом окне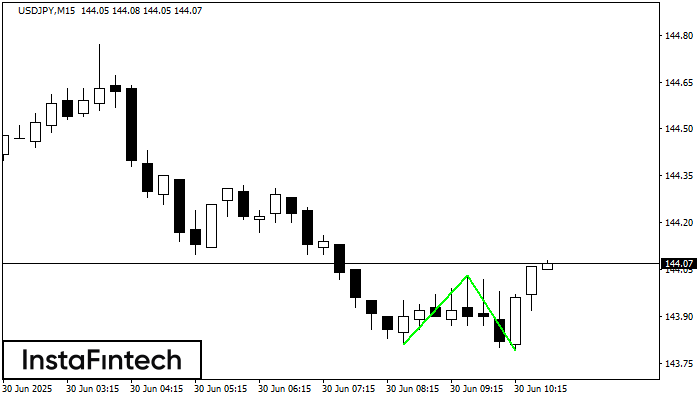
The Double Bottom pattern has been formed on USDJPY M15. Characteristics: the support level 143.81; the resistance level 144.03; the width of the pattern 22 points. If the resistance level
The M5 and M15 time frames may have more false entry points.
Открыть график инструмента в новом окне


