


signal strength 2 of 5
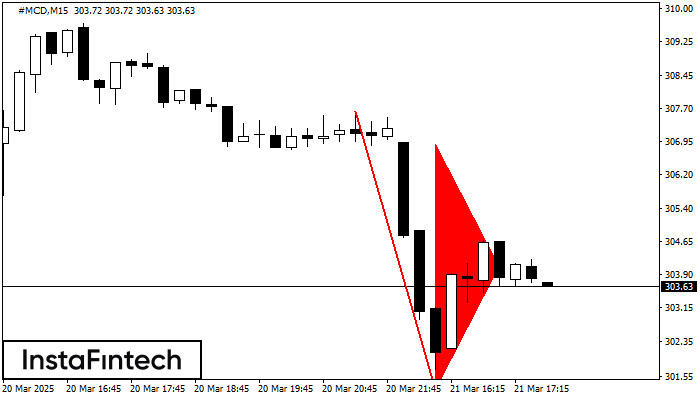
The Bearish pennant pattern has formed on the #MCD M15 chart. The pattern signals continuation of the downtrend in case the pennant’s low of 301.24 is broken through. Recommendations: Place the sell stop pending order 10 pips below the pattern’s low. Place the take profit order at the projection distance of the flagpole height.
The M5 and M15 time frames may have more false entry points.
See Also
- All
- Double Top
- Flag
- Head and Shoulders
- Pennant
- Rectangle
- Triangle
- Triple top
- All
- #AAPL
- #AMZN
- #Bitcoin
- #EBAY
- #FB
- #GOOG
- #INTC
- #KO
- #MA
- #MCD
- #MSFT
- #NTDOY
- #PEP
- #TSLA
- #TWTR
- AUDCAD
- AUDCHF
- AUDJPY
- AUDUSD
- EURCAD
- EURCHF
- EURGBP
- EURJPY
- EURNZD
- EURRUB
- EURUSD
- GBPAUD
- GBPCHF
- GBPJPY
- GBPUSD
- GOLD
- NZDCAD
- NZDCHF
- NZDJPY
- NZDUSD
- SILVER
- USDCAD
- USDCHF
- USDJPY
- USDRUB
- All
- M5
- M15
- M30
- H1
- D1
- All
- Buy
- Sale
- All
- 1
- 2
- 3
- 4
- 5
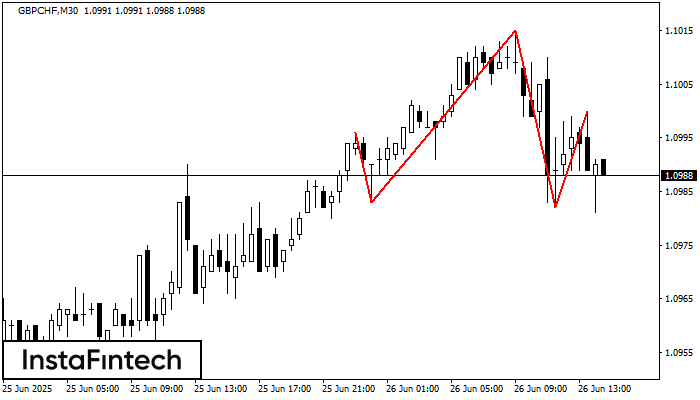
Os GBPCHF M30 formaram o padrão Cabeça & Ombros com as seguintes características: O topo da cabeça está em 1.1015, a linha do pescoço e o ângulo para cima estão
Open chart in a new window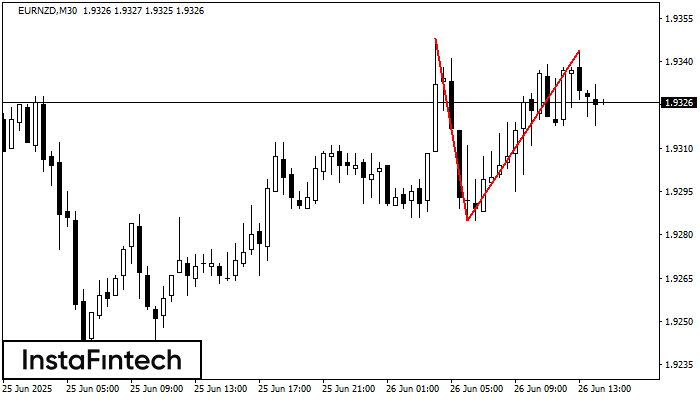
No gráfico de EURNZD M30 o padrão de reversão Topo duplo foi formado. Características: o limite superior 1.9344; o limite inferior 1.9285; a largura do padrão 59 pontos. O sinal
Open chart in a new window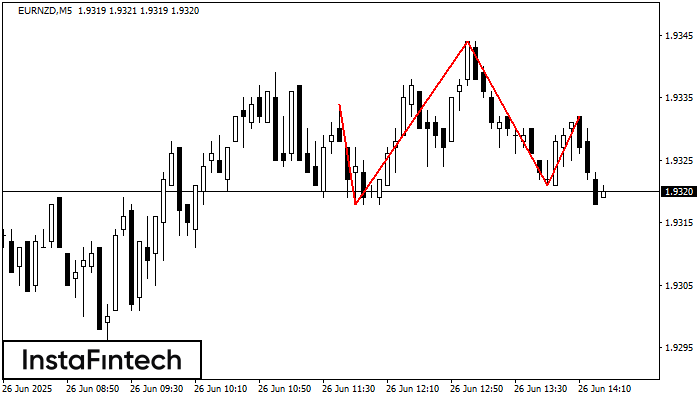
O padrão técnico chamado Cabeça & Ombros apareceu no gráfico de EURNZD M5. Há razões de peso para sugerir que o preço ultrapassará a Linha do Pescoço 1.9318/1.9321 após
Os intervalos M5 e M15 podem ter mais pontos de entrada falsos.
Open chart in a new window


