

signal strength 1 of 5
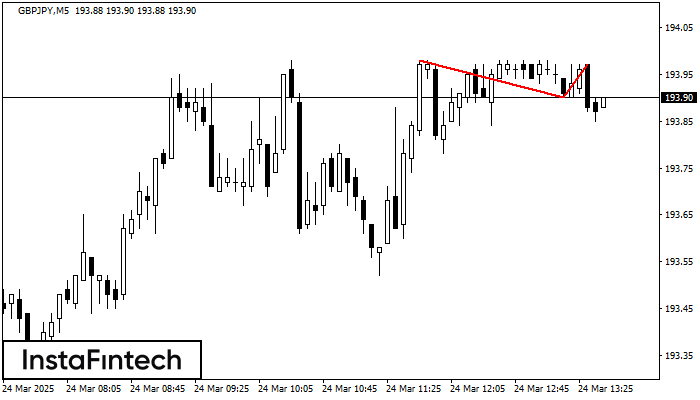
On the chart of GBPJPY M5 the Double Top reversal pattern has been formed. Characteristics: the upper boundary 193.97; the lower boundary 193.90; the width of the pattern 7 points. The signal: a break of the lower boundary will cause continuation of the downward trend targeting the 193.75 level.
The M5 and M15 time frames may have more false entry points.
- All
- Double Top
- Flag
- Head and Shoulders
- Pennant
- Rectangle
- Triangle
- Triple top
- All
- #AAPL
- #AMZN
- #Bitcoin
- #EBAY
- #FB
- #GOOG
- #INTC
- #KO
- #MA
- #MCD
- #MSFT
- #NTDOY
- #PEP
- #TSLA
- #TWTR
- AUDCAD
- AUDCHF
- AUDJPY
- AUDUSD
- EURCAD
- EURCHF
- EURGBP
- EURJPY
- EURNZD
- EURRUB
- EURUSD
- GBPAUD
- GBPCHF
- GBPJPY
- GBPUSD
- GOLD
- NZDCAD
- NZDCHF
- NZDJPY
- NZDUSD
- SILVER
- USDCAD
- USDCHF
- USDJPY
- USDRUB
- All
- M5
- M15
- M30
- H1
- D1
- All
- Buy
- Sale
- All
- 1
- 2
- 3
- 4
- 5

The Double Top reversal pattern has been formed on #Bitcoin M5. Characteristics: the upper boundary 107140.52; the lower boundary 106768.13; the width of the pattern is 38591 points. Sell trades
The M5 and M15 time frames may have more false entry points.
Open chart in a new window
According to the chart of M5, #Bitcoin formed the Bullish Symmetrical Triangle pattern. The lower border of the pattern touches the coordinates 106253.43/106928.98 whereas the upper border goes across 107645.53/106928.98
The M5 and M15 time frames may have more false entry points.
Open chart in a new window
The Double Bottom pattern has been formed on AUDCHF M30. This formation signals a reversal of the trend from downwards to upwards. The signal is that a buy trade should
Open chart in a new window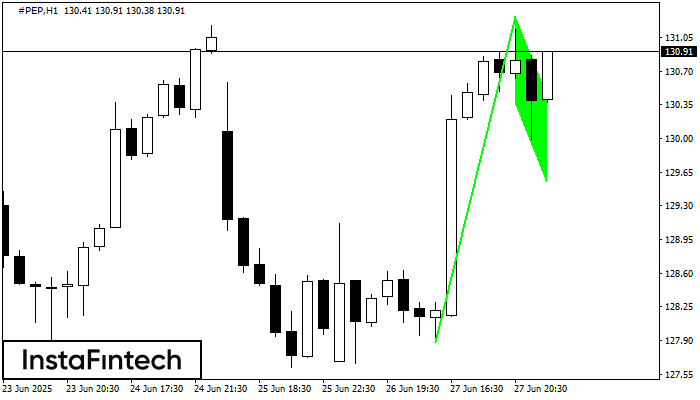
The Bullish Flag pattern has been formed on the chart #PEP H1 which signals that the upward trend will continue. Signals: а break of the peak at 131.27 may push
Open chart in a new window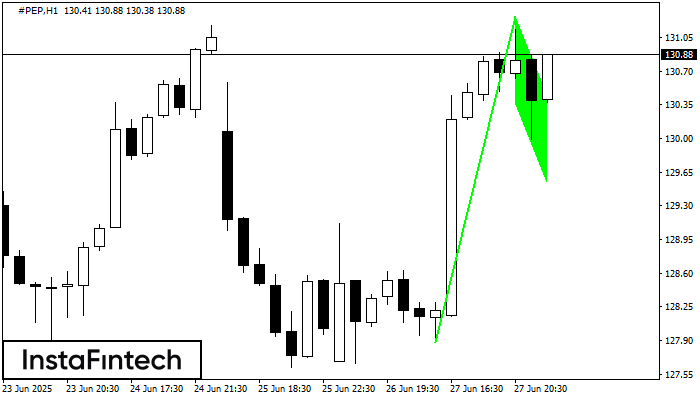
The Bullish Flag pattern has been formed on the chart #PEP H1 which signals that the upward trend will continue. Signals: а break of the peak at 131.27 may push
Open chart in a new window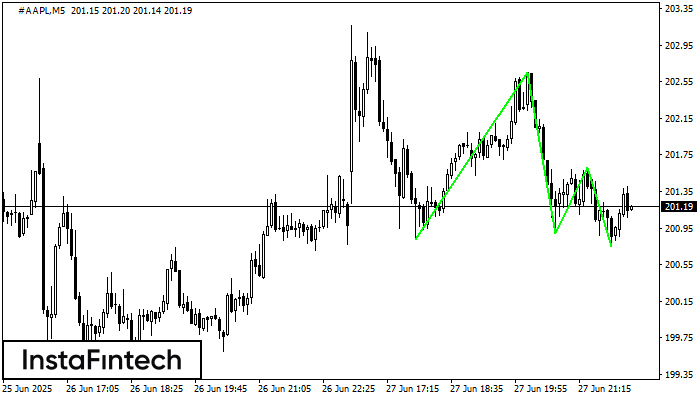
The Triple Bottom pattern has formed on the chart of the #AAPL M5 trading instrument. The pattern signals a change in the trend from downwards to upwards in the case
The M5 and M15 time frames may have more false entry points.
Open chart in a new window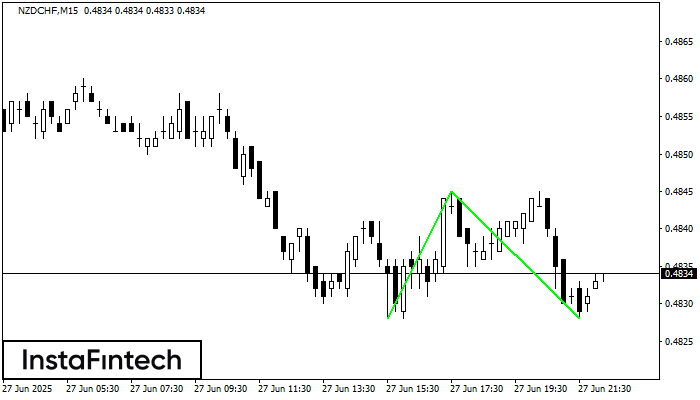
The Double Bottom pattern has been formed on NZDCHF M15. Characteristics: the support level 0.4828; the resistance level 0.4845; the width of the pattern 17 points. If the resistance level
The M5 and M15 time frames may have more false entry points.
Open chart in a new window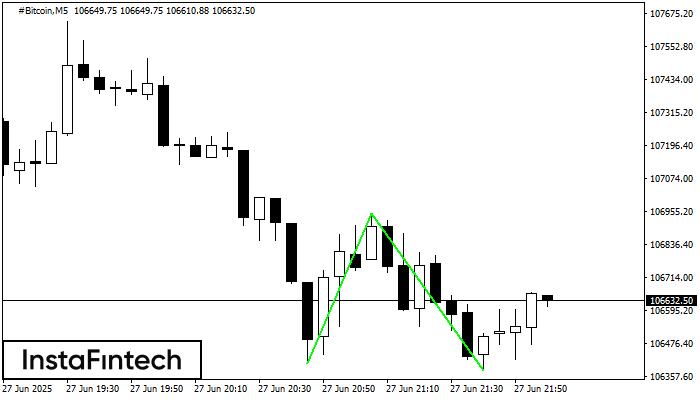
The Double Bottom pattern has been formed on #Bitcoin M5. Characteristics: the support level 106404.30; the resistance level 106949.53; the width of the pattern 54523 points. If the resistance level
The M5 and M15 time frames may have more false entry points.
Open chart in a new window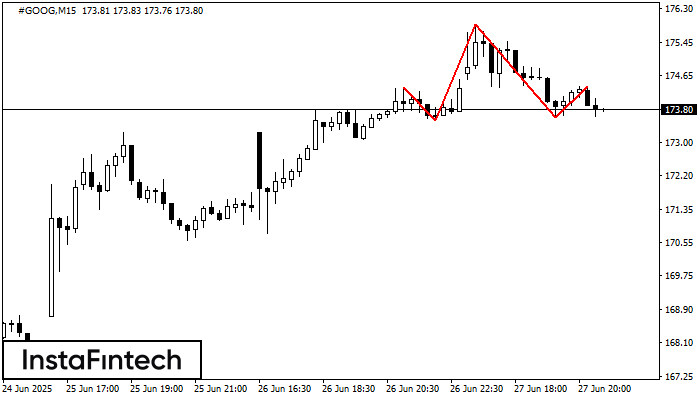
According to the chart of M15, #GOOG formed the Head and Shoulders pattern. The Head’s top is set at 175.90 while the median line of the Neck is found
The M5 and M15 time frames may have more false entry points.
Open chart in a new window


