


signal strength 2 of 5

According to the chart of M15, EURUSD formed the Bearish Symmetrical Triangle pattern. Description: The lower border is 1.0781/1.0799 and upper border is 1.0818/1.0799. The pattern width is measured on the chart at -37 pips. The formation of the Bearish Symmetrical Triangle pattern evidently signals a continuation of the downward trend. In other words, if the scenario comes true and EURUSD breaches the lower border, the price could continue its move toward 1.0776.
The M5 and M15 time frames may have more false entry points.
See Also
- All
- Double Top
- Flag
- Head and Shoulders
- Pennant
- Rectangle
- Triangle
- Triple top
- All
- #AAPL
- #AMZN
- #Bitcoin
- #EBAY
- #FB
- #GOOG
- #INTC
- #KO
- #MA
- #MCD
- #MSFT
- #NTDOY
- #PEP
- #TSLA
- #TWTR
- AUDCAD
- AUDCHF
- AUDJPY
- AUDUSD
- EURCAD
- EURCHF
- EURGBP
- EURJPY
- EURNZD
- EURRUB
- EURUSD
- GBPAUD
- GBPCHF
- GBPJPY
- GBPUSD
- GOLD
- NZDCAD
- NZDCHF
- NZDJPY
- NZDUSD
- SILVER
- USDCAD
- USDCHF
- USDJPY
- USDRUB
- All
- M5
- M15
- M30
- H1
- D1
- All
- Buy
- Sale
- All
- 1
- 2
- 3
- 4
- 5
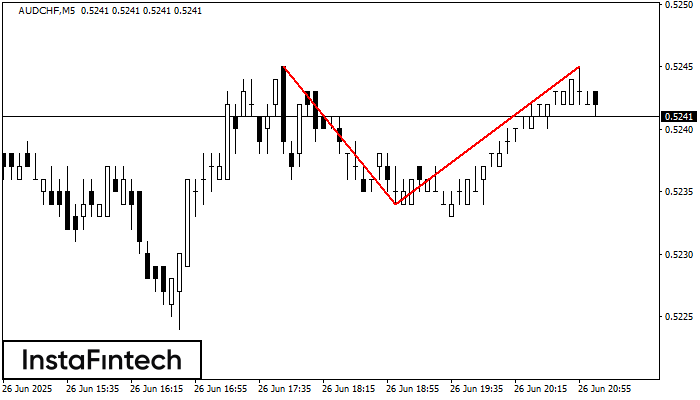
O padrão de reversão Topo duplo foi formado em AUDCHF M5. Características: o limite superior 0.5245; o limite inferior 0.5234; a largura do padrão é de 11 pontos. As operações
Os intervalos M5 e M15 podem ter mais pontos de entrada falsos.
Open chart in a new window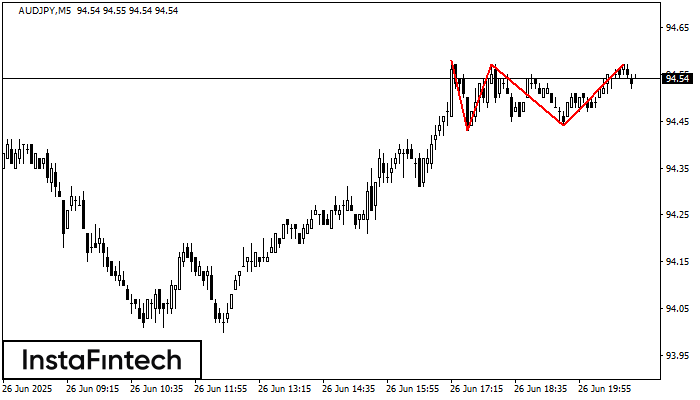
No gráfico do instrumento de negociação AUDJPY M5, o padrão Topo triplo que sinaliza uma mudança de tendência se formou. É possível que após a formação do terceiro pico
Os intervalos M5 e M15 podem ter mais pontos de entrada falsos.
Open chart in a new window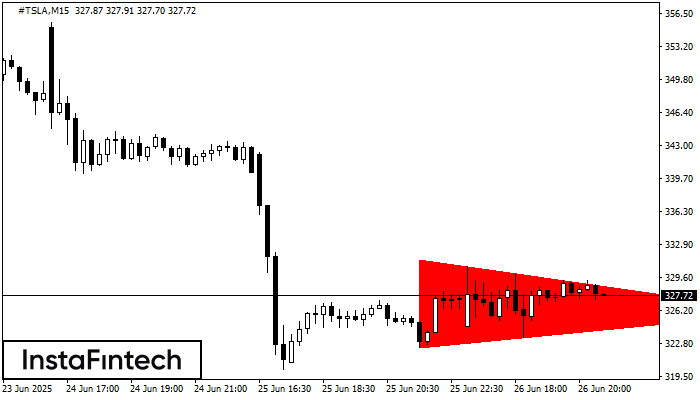
De acordo com o gráfico de M15, #TSLA fomrou o padrão de Triângulo Simétrico de Baixa. Este padrão sinaliza uma nova tendência de baixa se o limite inferior 322.39
Os intervalos M5 e M15 podem ter mais pontos de entrada falsos.
Open chart in a new window


