


signal strength 3 of 5
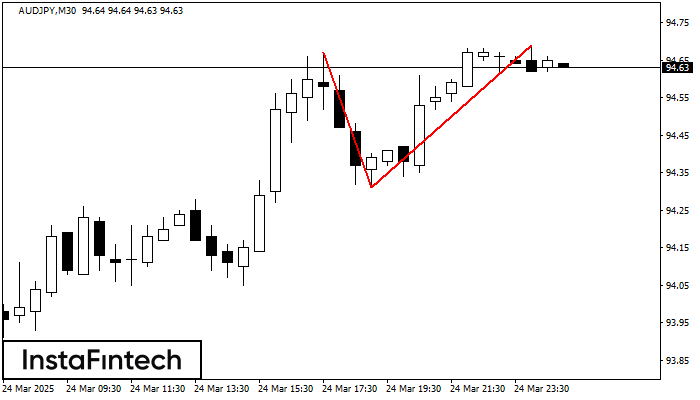
On the chart of AUDJPY M30 the Double Top reversal pattern has been formed. Characteristics: the upper boundary 94.69; the lower boundary 94.31; the width of the pattern 38 points. The signal: a break of the lower boundary will cause continuation of the downward trend targeting the 94.01 level.
See Also
- All
- Double Top
- Flag
- Head and Shoulders
- Pennant
- Rectangle
- Triangle
- Triple top
- All
- #AAPL
- #AMZN
- #Bitcoin
- #EBAY
- #FB
- #GOOG
- #INTC
- #KO
- #MA
- #MCD
- #MSFT
- #NTDOY
- #PEP
- #TSLA
- #TWTR
- AUDCAD
- AUDCHF
- AUDJPY
- AUDUSD
- EURCAD
- EURCHF
- EURGBP
- EURJPY
- EURNZD
- EURRUB
- EURUSD
- GBPAUD
- GBPCHF
- GBPJPY
- GBPUSD
- GOLD
- NZDCAD
- NZDCHF
- NZDJPY
- NZDUSD
- SILVER
- USDCAD
- USDCHF
- USDJPY
- USDRUB
- All
- M5
- M15
- M30
- H1
- D1
- All
- Buy
- Sale
- All
- 1
- 2
- 3
- 4
- 5

El patrón Triple Piso ha sido formado en #KO M5. Este tiene las siguientes características: nivel de resistencia 71.64/71.57; nivel de soporte 71.39/71.35; el ancho es 25 puntos. En caso
Los marcos de tiempo M5 y M15 pueden tener más puntos de entrada falsos.
Open chart in a new window
Según M5, NZDCAD está formando el patrón técnico: el Cabeza y Hombros Inverso. En caso de que la línea de cuello 0.8179/0.8176 se rompa, es posible que el instrumento
Los marcos de tiempo M5 y M15 pueden tener más puntos de entrada falsos.
Open chart in a new window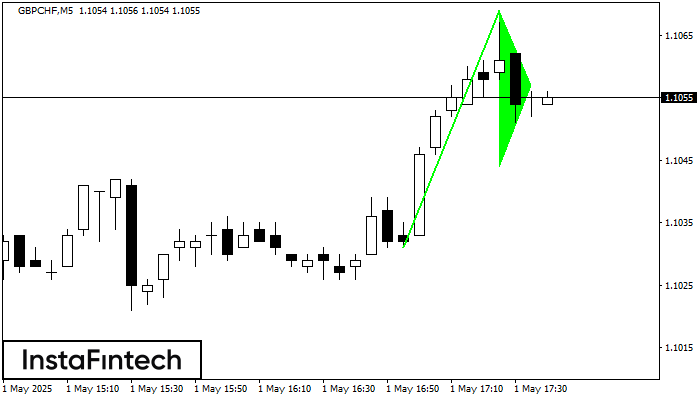
La señal Banderín alcista – Instrumento de negociación GBPCHF M5, patrón de continuación. Pronóstico: es posible establecer una posición de compra por encima del alza del patrón de 1.1069
Los marcos de tiempo M5 y M15 pueden tener más puntos de entrada falsos.
Open chart in a new window


