empty
сформирован 16.04 в 07:24:04 (UTC+0)
сила сигнала 1 из 5
Медвежий симметричный треугольник #Bitcoin M5

По #Bitcoin M5 сформировалась фигура «Медвежий симметричный треугольник». Данная фигура сигнализирует нам о продолжении нисходящего тренда в случае пробоя нижней границы 83067.39, где вероятная прибыль будет являться шириной текущей фигуры -98015 пунктов.

Таймфреймы М5 и М15 могут иметь больше ложных точек входа.

Смотрите также

Фигура
  • Все
  • Вымпел
  • Голова и плечи
  • Двойная вершина
  • Прямоугольник
  • Треугольник
  • Тройная вершина
  • Флаг
Инструмент
  • Все
  • #AAPL
  • #AMZN
  • #Bitcoin
  • #EBAY
  • #FB
  • #GOOG
  • #INTC
  • #KO
  • #MA
  • #MCD
  • #MSFT
  • #NTDOY
  • #PEP
  • #TSLA
  • #TWTR
  • AUDCAD
  • AUDCHF
  • AUDJPY
  • AUDUSD
  • EURCAD
  • EURCHF
  • EURGBP
  • EURJPY
  • EURNZD
  • EURRUB
  • EURUSD
  • GBPAUD
  • GBPCHF
  • GBPJPY
  • GBPUSD
  • GOLD
  • NZDCAD
  • NZDCHF
  • NZDJPY
  • NZDUSD
  • SILVER
  • USDCAD
  • USDCHF
  • USDJPY
  • USDRUB
Таймфрейм
  • Все
  • M5
  • M15
  • M30
  • H1
  • D1
Тренд
  • Все
  • Покупка
  • Продажа
Сила сигнала
  • Все
  • 1
  • 2
  • 3
  • 4
  • 5
Bullish Symmetrical Triangle
was formed on 27.06 at 15:02:19 (UTC+0)
signal strength 3 of 5
Bullish Symmetrical Triangle NZDJPY M30

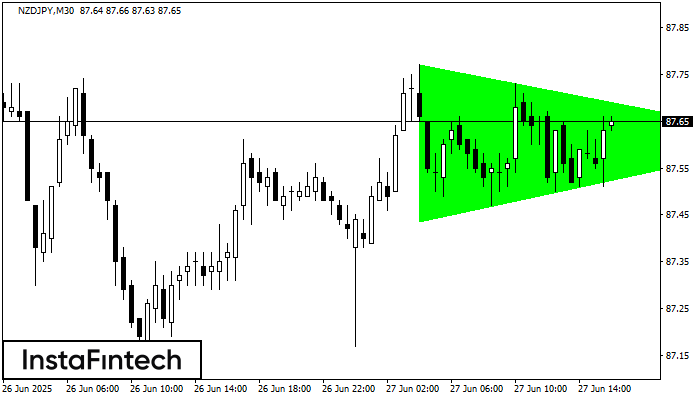
According to the chart of M30, NZDJPY formed the Bullish Symmetrical Triangle pattern. Description: This is the pattern of a trend continuation. 87.77 and 87.44 are the coordinates

Open chart in a new window
Double Bottom
was formed on 27.06 at 15:00:24 (UTC+0)
signal strength 2 of 5
Double Bottom AUDJPY M15

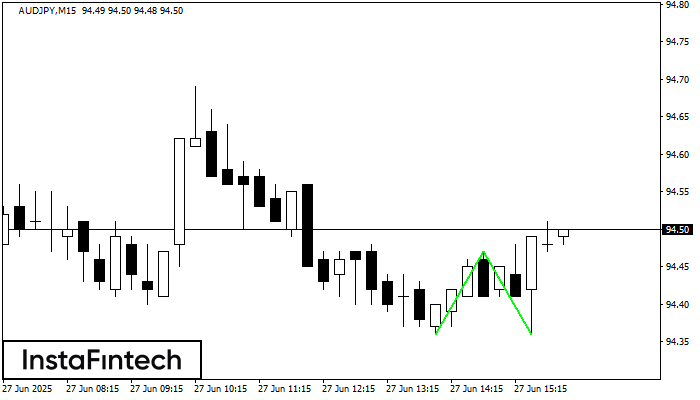
The Double Bottom pattern has been formed on AUDJPY M15. Characteristics: the support level 94.36; the resistance level 94.47; the width of the pattern 11 points. If the resistance level

The M5 and M15 time frames may have more false entry points.

Open chart in a new window
Double Bottom
was formed on 27.06 at 14:40:38 (UTC+0)
signal strength 1 of 5
Double Bottom NZDCAD M5

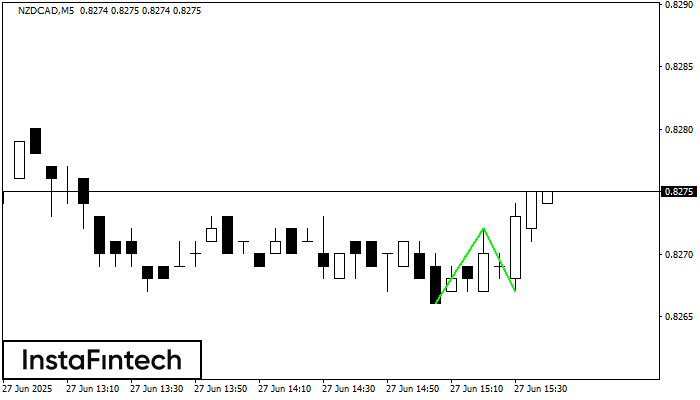
The Double Bottom pattern has been formed on NZDCAD M5; the upper boundary is 0.8272; the lower boundary is 0.8267. The width of the pattern is 6 points. In case

The M5 and M15 time frames may have more false entry points.

Open chart in a new window
Сейчас не можете говорить по телефону?
Задайте Ваш вопрос в чате.
Обратный звонок
 

Dear visitor,

Your IP address shows that you are currently located in the USA. If you are a resident of the United States, you are prohibited from using the services of InstaFintech Group including online trading, online transfers, deposit/withdrawal of funds, etc.

If you think you are seeing this message by mistake and your location is not the US, kindly proceed to the website. Otherwise, you must leave the website in order to comply with government restrictions.

Why does your IP address show your location as the USA?

  • - you are using a VPN provided by a hosting company based in the United States;
  • - your IP does not have proper WHOIS records;
  • - an error occurred in the WHOIS geolocation database.

Please confirm whether you are a US resident or not by clicking the relevant button below. If you choose the wrong option, being a US resident, you will not be able to open an account with InstaForex anyway.

We are sorry for any inconvenience caused by this message.