

signal strength 3 of 5
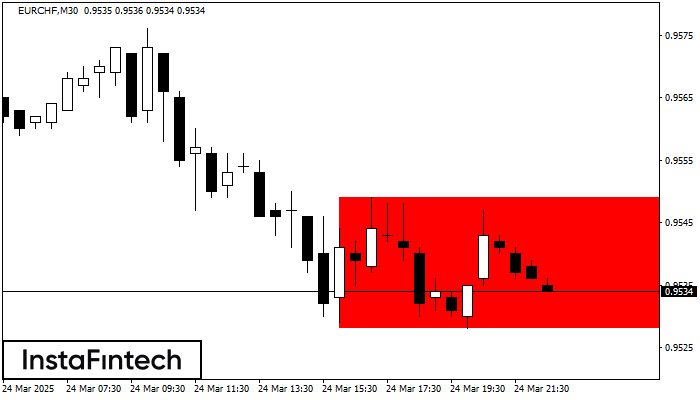
According to the chart of M30, EURCHF formed the Bearish Rectangle. This type of a pattern indicates a trend continuation. It consists of two levels: resistance 0.9549 - 0.0000 and support 0.9528 – 0.9528. In case the resistance level 0.9528 - 0.9528 is broken, the instrument is likely to follow the bearish trend.
See Also
- All
- Double Top
- Flag
- Head and Shoulders
- Pennant
- Rectangle
- Triangle
- Triple top
- All
- #AAPL
- #AMZN
- #Bitcoin
- #EBAY
- #FB
- #GOOG
- #INTC
- #KO
- #MA
- #MCD
- #MSFT
- #NTDOY
- #PEP
- #TSLA
- #TWTR
- AUDCAD
- AUDCHF
- AUDJPY
- AUDUSD
- EURCAD
- EURCHF
- EURGBP
- EURJPY
- EURNZD
- EURRUB
- EURUSD
- GBPAUD
- GBPCHF
- GBPJPY
- GBPUSD
- GOLD
- NZDCAD
- NZDCHF
- NZDJPY
- NZDUSD
- SILVER
- USDCAD
- USDCHF
- USDJPY
- USDRUB
- All
- M5
- M15
- M30
- H1
- D1
- All
- Buy
- Sale
- All
- 1
- 2
- 3
- 4
- 5
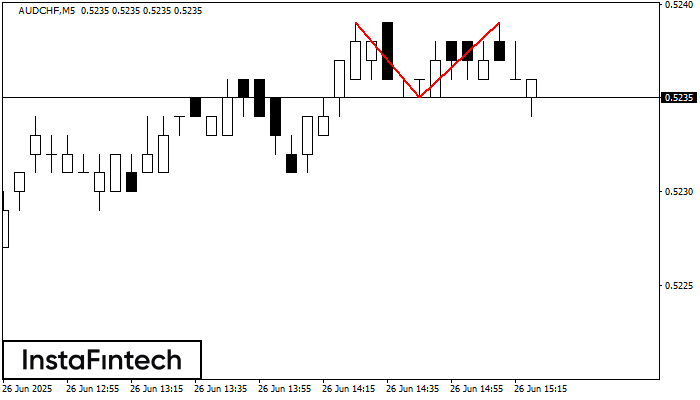
The Double Top pattern has been formed on AUDCHF M5. It signals that the trend has been changed from upwards to downwards. Probably, if the base of the pattern 0.5235
The M5 and M15 time frames may have more false entry points.
Open chart in a new window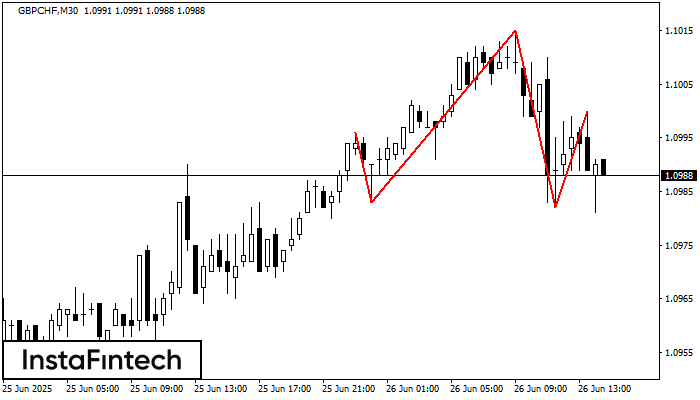
The GBPCHF M30 formed the Head and Shoulders pattern with the following features: The Head’s top is at 1.1015, the Neckline and the upward angle are at 1.0983/1.0982. The formation
Open chart in a new window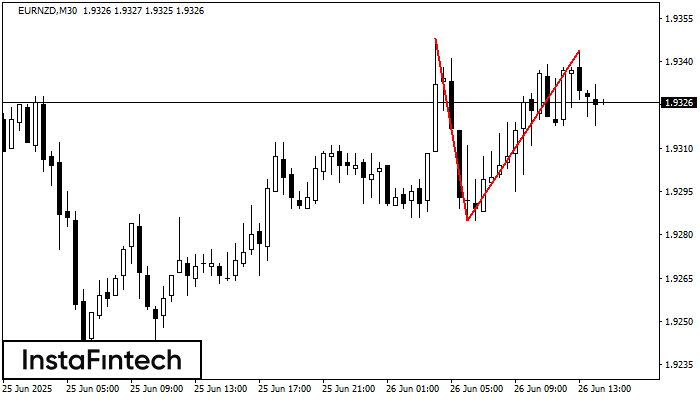
On the chart of EURNZD M30 the Double Top reversal pattern has been formed. Characteristics: the upper boundary 1.9344; the lower boundary 1.9285; the width of the pattern 59 points
Open chart in a new window


