

signal strength 3 of 5
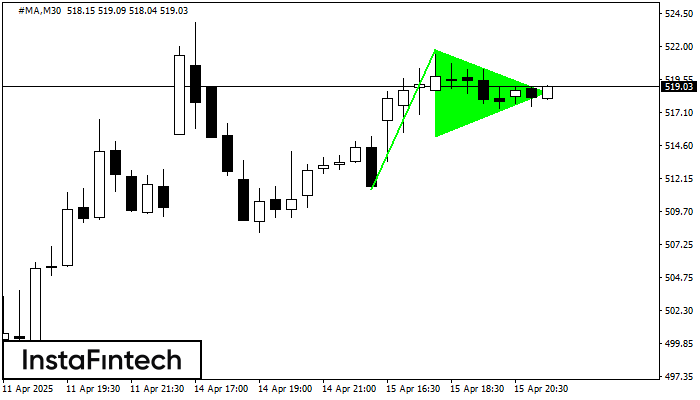
The Bullish pennant signal – Trading instrument #MA M30, continuation pattern. Forecast: it is possible to set up a buy position above the pattern’s high of 521.82, with the prospect of the next move being a projection of the flagpole height.
- All
- Double Top
- Flag
- Head and Shoulders
- Pennant
- Rectangle
- Triangle
- Triple top
- All
- #AAPL
- #AMZN
- #Bitcoin
- #EBAY
- #FB
- #GOOG
- #INTC
- #KO
- #MA
- #MCD
- #MSFT
- #NTDOY
- #PEP
- #TSLA
- #TWTR
- AUDCAD
- AUDCHF
- AUDJPY
- AUDUSD
- EURCAD
- EURCHF
- EURGBP
- EURJPY
- EURNZD
- EURRUB
- EURUSD
- GBPAUD
- GBPCHF
- GBPJPY
- GBPUSD
- GOLD
- NZDCAD
- NZDCHF
- NZDJPY
- NZDUSD
- SILVER
- USDCAD
- USDCHF
- USDJPY
- USDRUB
- All
- M5
- M15
- M30
- H1
- D1
- All
- Buy
- Sale
- All
- 1
- 2
- 3
- 4
- 5
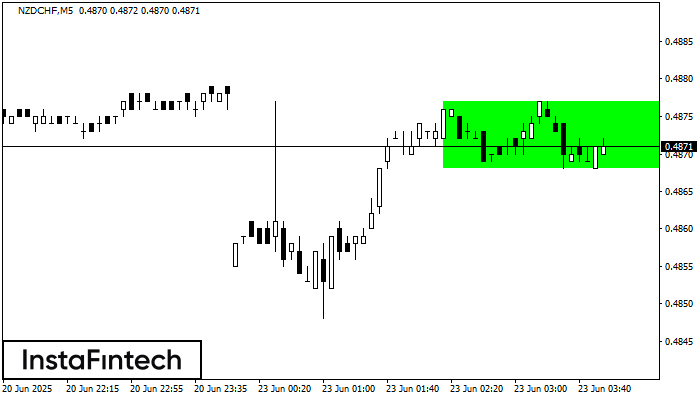
According to the chart of M5, NZDCHF formed the Bullish Rectangle which is a pattern of a trend continuation. The pattern is contained within the following borders: the lower border
The M5 and M15 time frames may have more false entry points.
Открыть график инструмента в новом окне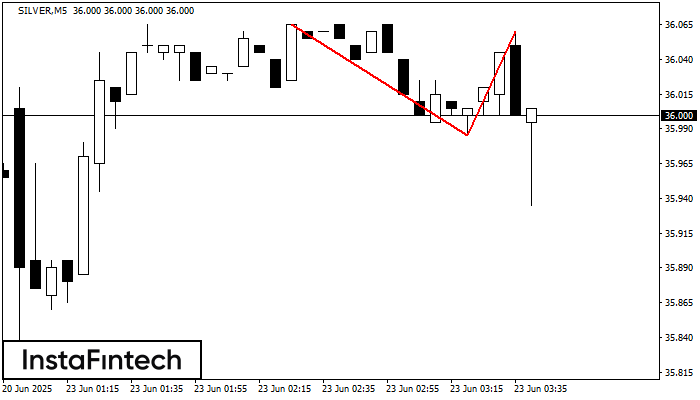
The Double Top reversal pattern has been formed on SILVER M5. Characteristics: the upper boundary 36.06; the lower boundary 35.98; the width of the pattern is 75 points. Sell trades
The M5 and M15 time frames may have more false entry points.
Открыть график инструмента в новом окне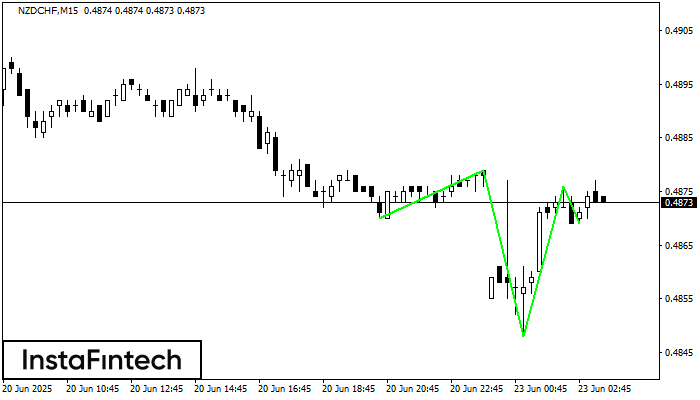
According to the chart of M15, NZDCHF formed the Inverse Head and Shoulder pattern. The Head’s top is set at 0.4876 while the median line of the Neck is found
The M5 and M15 time frames may have more false entry points.
Открыть график инструмента в новом окне


