

signal strength 2 of 5

The #Bitcoin M15 formed the Head and Shoulders pattern with the following features: The Head’s top is at 88742.88, the Neckline and the upward angle are at 87100.22/87010.53. The formation of this pattern can bring about changes in the current trend from bullish to bearish. In case the pattern triggers the expected changes, the price of #Bitcoin will go towards 87010.30.
The M5 and M15 time frames may have more false entry points.
- All
- Double Top
- Flag
- Head and Shoulders
- Pennant
- Rectangle
- Triangle
- Triple top
- All
- #AAPL
- #AMZN
- #Bitcoin
- #EBAY
- #FB
- #GOOG
- #INTC
- #KO
- #MA
- #MCD
- #MSFT
- #NTDOY
- #PEP
- #TSLA
- #TWTR
- AUDCAD
- AUDCHF
- AUDJPY
- AUDUSD
- EURCAD
- EURCHF
- EURGBP
- EURJPY
- EURNZD
- EURRUB
- EURUSD
- GBPAUD
- GBPCHF
- GBPJPY
- GBPUSD
- GOLD
- NZDCAD
- NZDCHF
- NZDJPY
- NZDUSD
- SILVER
- USDCAD
- USDCHF
- USDJPY
- USDRUB
- All
- M5
- M15
- M30
- H1
- D1
- All
- Buy
- Sale
- All
- 1
- 2
- 3
- 4
- 5
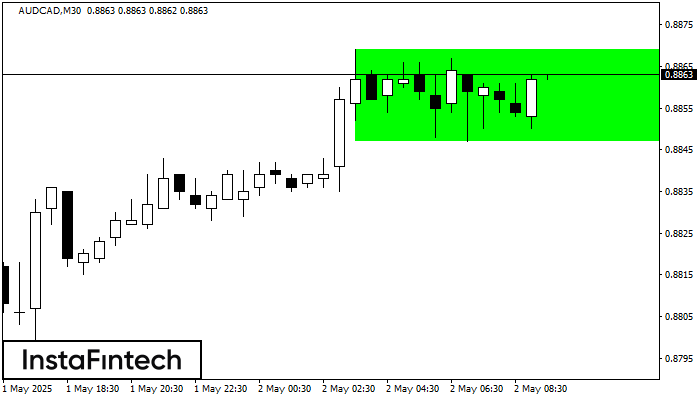
Según el gráfico de M30, AUDCAD formó el Rectángulo Alcista. El patrón indica la continuación de una tendencia. El límite superior es 0.8869, el límite inferior es 0.8847. La señal
Open chart in a new window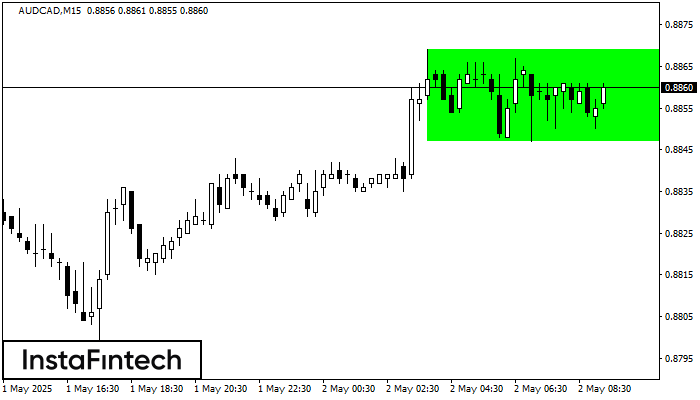
Según el gráfico de M15, AUDCAD formó el Rectángulo Alcista. Este tipo de patrón indica la continuación de una tendencia. Esto consiste de dos niveles: resistencia 0.8869 y soporte 0.8847
Los marcos de tiempo M5 y M15 pueden tener más puntos de entrada falsos.
Open chart in a new window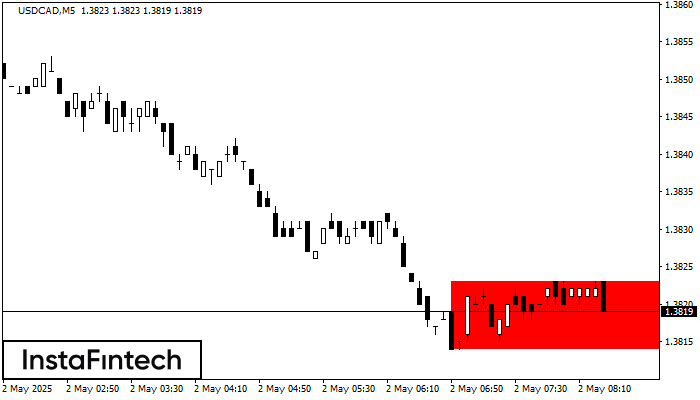
Según el gráfico de M5, USDCAD formó el Rectángulo Bajista que es un patrón de la continuación de una tendencia. El patrón está contenido dentro de los siguientes límites: límite
Los marcos de tiempo M5 y M15 pueden tener más puntos de entrada falsos.
Open chart in a new window


