


signal strength 1 of 5
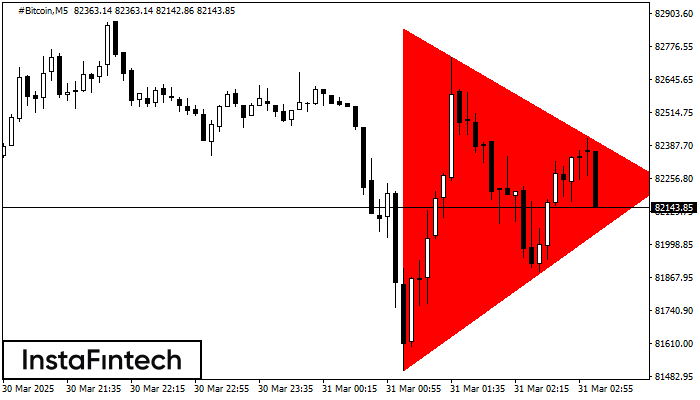
According to the chart of M5, #Bitcoin formed the Bearish Symmetrical Triangle pattern. Description: The lower border is 81505.64/82241.48 and upper border is 82843.91/82241.48. The pattern width is measured on the chart at -133827 pips. The formation of the Bearish Symmetrical Triangle pattern evidently signals a continuation of the downward trend. In other words, if the scenario comes true and #Bitcoin breaches the lower border, the price could continue its move toward 82241.33.
The M5 and M15 time frames may have more false entry points.
Vea asimismo
- All
- Double Top
- Flag
- Head and Shoulders
- Pennant
- Rectangle
- Triangle
- Triple top
- All
- #AAPL
- #AMZN
- #Bitcoin
- #EBAY
- #FB
- #GOOG
- #INTC
- #KO
- #MA
- #MCD
- #MSFT
- #NTDOY
- #PEP
- #TSLA
- #TWTR
- AUDCAD
- AUDCHF
- AUDJPY
- AUDUSD
- EURCAD
- EURCHF
- EURGBP
- EURJPY
- EURNZD
- EURRUB
- EURUSD
- GBPAUD
- GBPCHF
- GBPJPY
- GBPUSD
- GOLD
- NZDCAD
- NZDCHF
- NZDJPY
- NZDUSD
- SILVER
- USDCAD
- USDCHF
- USDJPY
- USDRUB
- All
- M5
- M15
- M30
- H1
- D1
- All
- Buy
- Sale
- All
- 1
- 2
- 3
- 4
- 5
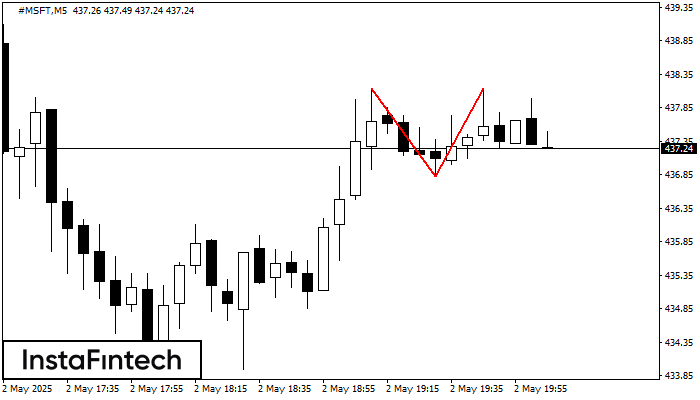
The Double Top pattern has been formed on #MSFT M5. It signals that the trend has been changed from upwards to downwards. Probably, if the base of the pattern 436.83
The M5 and M15 time frames may have more false entry points.
Open chart in a new window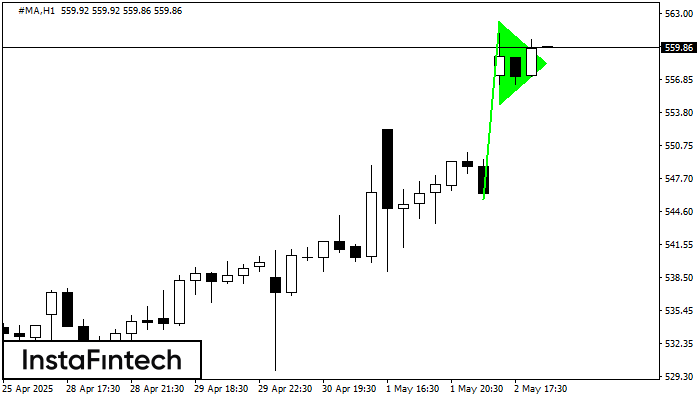
The Bullish pennant graphic pattern has formed on the #MA H1 instrument. This pattern type falls under the category of continuation patterns. In this case, if the quote can breaks
Open chart in a new window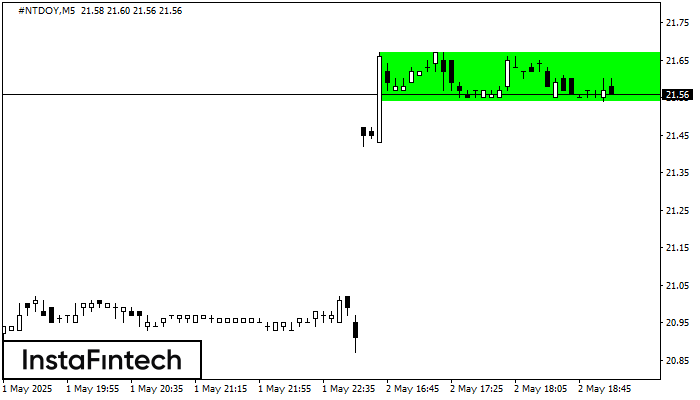
According to the chart of M5, #NTDOY formed the Bullish Rectangle. The pattern indicates a trend continuation. The upper border is 21.67, the lower border is 21.54. The signal means
The M5 and M15 time frames may have more false entry points.
Open chart in a new window


