

signal strength 3 of 5
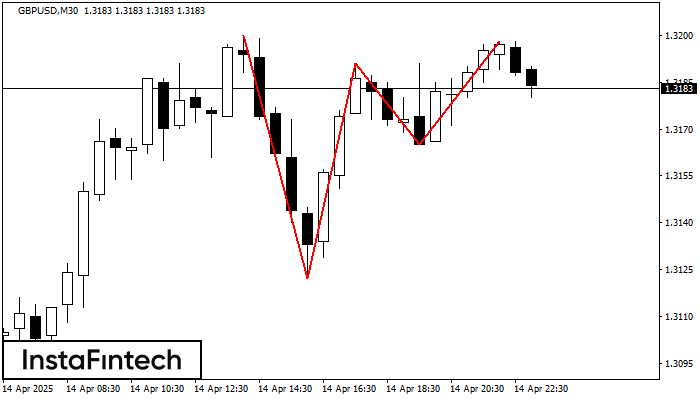
The Triple Top pattern has formed on the chart of the GBPUSD M30 trading instrument. It is a reversal pattern featuring the following characteristics: resistance level 2, support level -43, and pattern’s width 78. Forecast If the price breaks through the support level 1.3122, it is likely to move further down to 1.3161.
- All
- Double Top
- Flag
- Head and Shoulders
- Pennant
- Rectangle
- Triangle
- Triple top
- All
- #AAPL
- #AMZN
- #Bitcoin
- #EBAY
- #FB
- #GOOG
- #INTC
- #KO
- #MA
- #MCD
- #MSFT
- #NTDOY
- #PEP
- #TSLA
- #TWTR
- AUDCAD
- AUDCHF
- AUDJPY
- AUDUSD
- EURCAD
- EURCHF
- EURGBP
- EURJPY
- EURNZD
- EURRUB
- EURUSD
- GBPAUD
- GBPCHF
- GBPJPY
- GBPUSD
- GOLD
- NZDCAD
- NZDCHF
- NZDJPY
- NZDUSD
- SILVER
- USDCAD
- USDCHF
- USDJPY
- USDRUB
- All
- M5
- M15
- M30
- H1
- D1
- All
- Buy
- Sale
- All
- 1
- 2
- 3
- 4
- 5
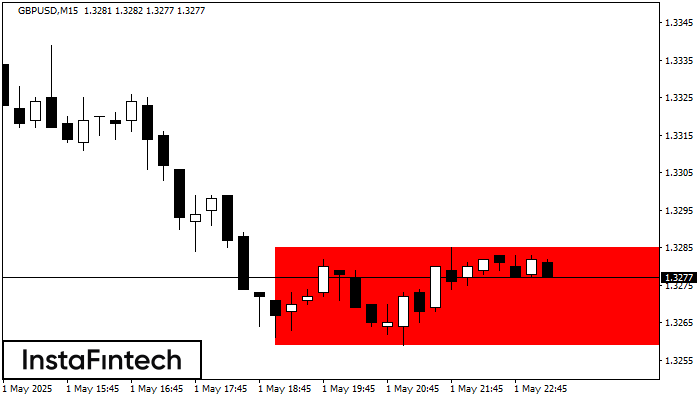
Según el gráfico de M15, GBPUSD formó el Rectángulo Bajista. El patrón indica la continuación de una tendencia. El límite superior es 1.3285, el límite inferior es 1.3259. La señal
Los marcos de tiempo M5 y M15 pueden tener más puntos de entrada falsos.
Open chart in a new window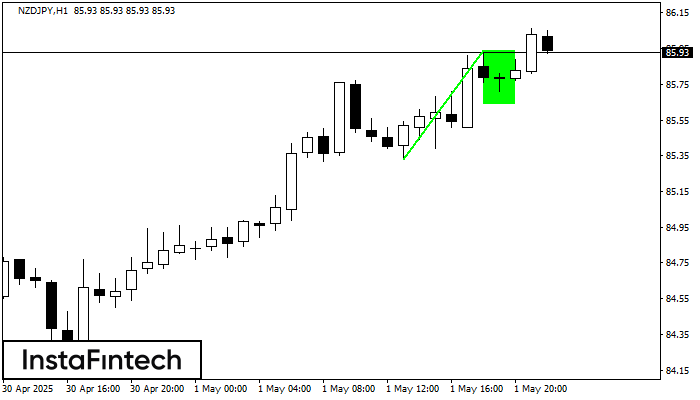
El patrón Bandera alcista que señala la continuación de una tendencia ha sido formado en el gráfico NZDJPY H1. Pronóstico: si el precio rompe por encima del alza del patrón
Open chart in a new window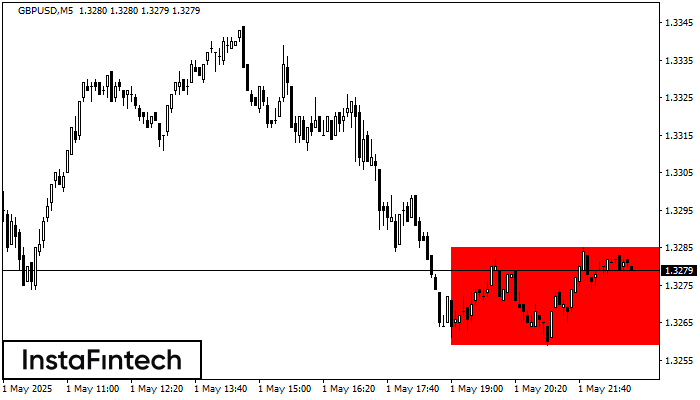
Según el gráfico de M5, GBPUSD formó el Rectángulo Bajista. Este tipo de patrón indica la continuación de una tendencia. Esto consiste de dos niveles: resistencia 1.3285 - 0.0000
Los marcos de tiempo M5 y M15 pueden tener más puntos de entrada falsos.
Open chart in a new window


