

signal strength 1 of 5
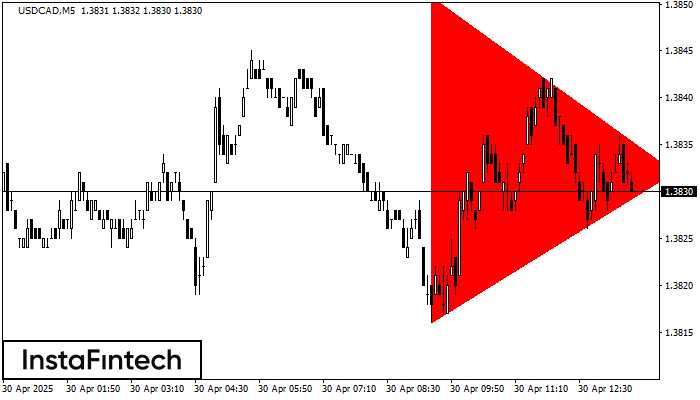
According to the chart of M5, USDCAD formed the Bearish Symmetrical Triangle pattern. Description: The lower border is 1.3816/1.3832 and upper border is 1.3851/1.3832. The pattern width is measured on the chart at -35 pips. The formation of the Bearish Symmetrical Triangle pattern evidently signals a continuation of the downward trend. In other words, if the scenario comes true and USDCAD breaches the lower border, the price could continue its move toward 1.3817.
The M5 and M15 time frames may have more false entry points.
Vea asimismo
- All
- Double Top
- Flag
- Head and Shoulders
- Pennant
- Rectangle
- Triangle
- Triple top
- All
- #AAPL
- #AMZN
- #Bitcoin
- #EBAY
- #FB
- #GOOG
- #INTC
- #KO
- #MA
- #MCD
- #MSFT
- #NTDOY
- #PEP
- #TSLA
- #TWTR
- AUDCAD
- AUDCHF
- AUDJPY
- AUDUSD
- EURCAD
- EURCHF
- EURGBP
- EURJPY
- EURNZD
- EURRUB
- EURUSD
- GBPAUD
- GBPCHF
- GBPJPY
- GBPUSD
- GOLD
- NZDCAD
- NZDCHF
- NZDJPY
- NZDUSD
- SILVER
- USDCAD
- USDCHF
- USDJPY
- USDRUB
- All
- M5
- M15
- M30
- H1
- D1
- All
- Buy
- Sale
- All
- 1
- 2
- 3
- 4
- 5
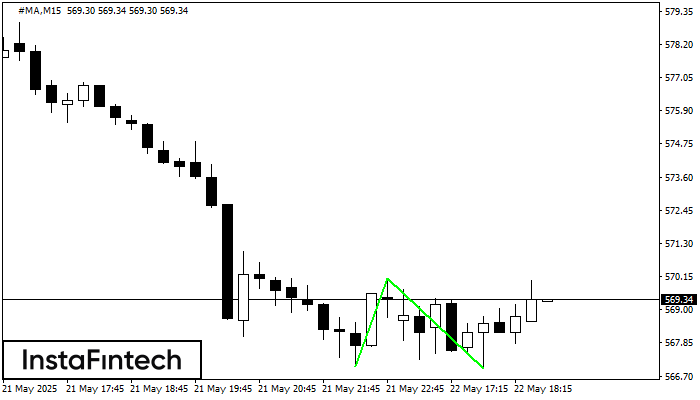
El patrón Doble Piso ha sido formado en #MA M15. Esta formación señala una reversión de la tendencia de bajista a alcista. La señal es que se debe abrir
Los marcos de tiempo M5 y M15 pueden tener más puntos de entrada falsos.
Open chart in a new window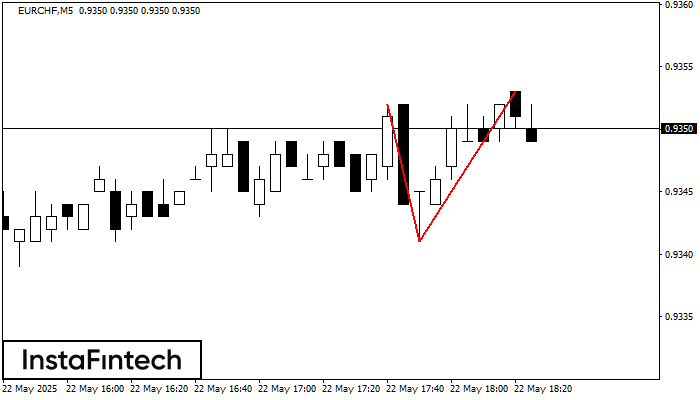
El patrón de reversión Doble Techo ha sido formado en EURCHF M5. Características: el límite superior 0.9352; el límite inferior 0.9341; el ancho del patrón es 12 puntos. Es mejor
Los marcos de tiempo M5 y M15 pueden tener más puntos de entrada falsos.
Open chart in a new window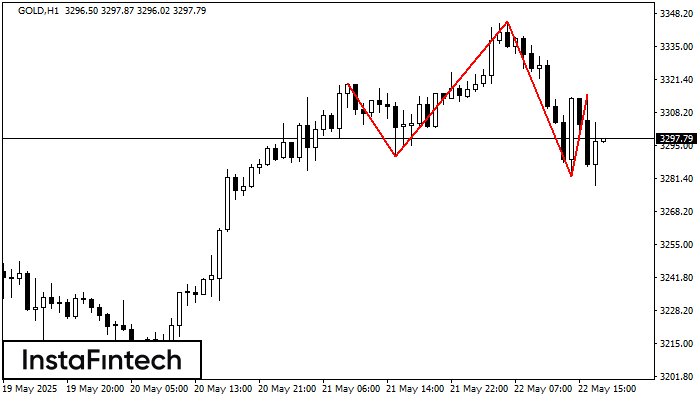
El GOLD H1 formó el patrón Cabeza y Hombros con las siguientes características: El techo de la Cabeza se encuentra en 3344.99, la línea de cuello y el ángulo alcista
Open chart in a new window


