empty
16.12.2022 11:53 AM
Technical analysis of EUR/USD for December 16, 2022

This image is no longer relevant

Overview :

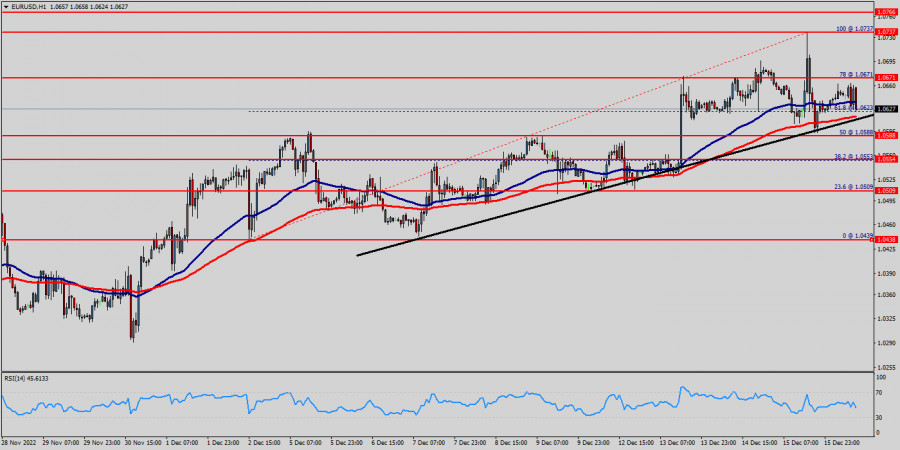
The EUR/USD pair faced a minor resistance at the level of 1.0671, while major resistance is seen at 1.0737. Support is found at the levels of 1.0588 and 1.0554. Also, it should be noted that a daily pivot point has already set at the level of 1.0588. The EUR/USD pair is still moving around the key level at 1.0588, which represents a daily bottom in the H1 time frame at the moment. The EUR/USD pair will continue rising from the level of 1.0588 in the long term. It should be noted that the support is established at the level of 1.0588 which represents the daily pivot point.

The EUR/USD pair continued to move upwards from the level of 1.0588. The pair rose from the level of 1.0588 to the top around 1.0737. However, the trend rebounded from the top point of 1.0737 to close at 1.0618.

The level of 1.0588 is expected to act as major support today. According to the previous events, the EUR/USD pair is still moving between the levels of 1.0588 and 1.0737.

Therefore, we expect a range of 149 pips in coming two days. The trend is still above the 100 EMA for that the bullish outlook remains the same as long as the 100 EMA is headed to the upside.

But, the price spot of 1.0588 remains a significant support zone. Since the trend is above the last bearish wave, the market is still in an uptrend. Overall, we still prefer the bullish scenario. Consequently, there is a possibility that the EUR/USD pair will move upside.

The structure of scaling does not look corrective. In order to indicate a bullish opportunity above the area of 1.0588, buy above the price of 1.0588 with the first target at 1.0737 (double top).

The EUR/USD pair has broken resistance at the level of 1.0588 which acts as support now. Thus, the pair has already formed minor support at 1.0588.

The strong support is seen at the level of 1.0554 because it represents the weekly support 1. Technical readings in the daily chart favor a bullish continuation, as indicators maintain their firmly bullish slopes within positive levels, while the 100 MA heads firmly higher below the current level. Equally important, the RSI and the moving average (100) are still calling for an uptrend.

Therefore, the market indicates a bullish opportunity at the level of 1.0588 in the H1 chart. Also, if the trend is buoyant, then the currency pair strength will be defined as following: EUR is in an uptrend and USD is in a downtrend. Buy above the minor support of 1.0588 (this price is coinciding with the ratio of 50% Fibonacci) with the first target at 1.0737, and continue towards 1.0766 (the weekly resistance 2).

Next objective will target at 1.0803 in coming days. On the other hand, if the price closes below the minor support (1.0588), the best location for the stop loss order is seen below 1.0554; hence, the price will fall into the bearish market in order to go further towards the strong support at 1.0509 to test it again.

The level of 1.0509 will form a double bottom. On the downside, break of 1.0588 minor support will suggest that such rebound has completed and bring retest of 1.0509 low instead.

เลือกช่วงเวลา
5
นาที
15
นาที
30
นาที
1
ชั่วโมง
4
ชั่วโมง
1
วัน
1
สัปดาห์
รับผลกำไรจากการเปลี่ยนแปลงอัตราสกุลเงินดิจิทัลกับ InstaForex.
ดาวน์โหลด MetaTrader 4 และเปิดการซื้อขายครั้งแรกของคุณ.
XAU/USD: การวิเคราะห์และพยากรณ์ วันนี้ ราคาทองคำกำลังดึงดูดผู้ขายรายใหม่ ท่ามกลางการเพิ่มขึ้นของความขัดแย้งระหว่างอิหร่านและอิสราเอล สหรัฐอเมริกาได้โจมตีทางอากาศต่อโรงงานนิวเคลียร์ของอิหร่านสามแห่งในฟอร์โดว นาทันซ์ และอิสฟาฮานในเช้าวันอาทิตย์ การกระทำเหล่านี้บ่งชี้สถานการณ์ที่แย่ลงอย่างชัดเจนในตะวันออกกลางและทำให้เกิดความกังวลเรื่องความขัดแย้งที่อาจขยายตัวมากขึ้น ซึ่งสนับสนุนสถานะของดอลลาร์สหรัฐในฐานะสกุลเงินสำรองของโลก รัฐมนตรีต่างประเทศอิหร่าน Abbas Araghchi กล่าวว่าอิหร่านจะปกป้องตนเองด้วยวิธีการทุกวิถีทางที่จำเป็น ไม่เพียงต่อการโจมตีทางทหารของสหรัฐฯ เท่านั้น แต่ยังต่อการกระทำที่
  • Grand Choice
    Contest by
    InstaForex
    InstaForex always strives to help you
    fulfill your biggest dreams.
    เข้าร่วมการแข่งขัน


บทความแนะนำ

USD/JPY. การวิเคราะห์และพยากรณ์สถานการณ์ตลาดปัจจุบัน

จากมุมมองทางเทคนิค เมื่อกระทิงสามารถผ่านด่านด่านกับ 100-day Simple Moving Average (SMA) รอบระดับ 146.80 จะยังคงครอบงำตลาด การซื้อที่เกินระดับจิตวิทยา 147.00 ยืนยันมุมมองเชิงบวกที่เด่นชัด ดันราคา spot

Irina Yanina 17:53 2025-06-23 UTC+2

สัญญาณการซื้อขายสำหรับ EUR/USD ระหว่างวันที่ 23-28 มิถุนายน 2025: ซื้อเหนือ 1.1460 (21 SMA - 6/8 Murray)

ในทางตรงกันข้าม พื้นที่นี้รอบๆ 21SMA ซึ่งตั้งอยู่ที่ระดับจิตวิทยา 1.15 ถือว่าเป็นกุญแจสำคัญ ถ้าราคาลดลงต่ำกว่าพื้นที่นี้ เราอาจคาดการณ์ว่าจะเกิดการทะลุออกของแนวโน้มขาขึ้นอย่างรวดเร็วและยูโรอาจลดลงไปสู่อัตรา 4/8 Murray ที่ตั้งอยู่ที่ 1.1230 ทั้งนี้ เรายังคาดหวังว่าจะเติมช่องว่างที่เคยเกิดขึ้นที่ 1.1180

Dimitrios Zappas 16:34 2025-06-23 UTC+2

สัญญาณการซื้อขายสำหรับทองคำ (XAU/USD) ระหว่างวันที่ 23-28 มิถุนายน 2025: ซื้อเมื่อราคาสูงกว่า $3,350 (21 SMA - 7/8 Murray)

หากราคาทองคำยังคงฟื้นตัวและตั้งตัวอยู่เหนือเส้นค่าเฉลี่ย 21 วันที่ 3,364 นี่อาจเป็นโอกาสในการซื้อ โดยมีเป้าหมายที่ 8/8 มัลเรย์ ที่ 3,437 สุดท้ายแล้วโลหะนี้อาจไปถึง +1/8 มัลเรย์ ที่ประมาณ 3,515

Dimitrios Zappas 16:23 2025-06-23 UTC+2

การพยากรณ์อัตราแลกเปลี่ยนเงินตรา 23/06/2025: EUR/USD, GBP/USD, USDX, น้ำมัน, Ethereum และ Bitcoin

ลิงก์ที่เป็นประโยชน์: บทความอื่นๆ ของฉันสามารถอ่านได้ในส่วนนี้ หลักสูตร InstaForex สำหรับมือใหม่ ข้อมูลวิเคราะห์ยอดนิยม เปิดบัญชีซื้อขาย สำคัญ: ผู้เริ่มต้นในตลาดฟอร์เร็กซ์ควรระมัดระวังเป็นพิเศษเมื่อทำการตัดสินใจเกี่ยวกับการเข้าสู่ตลาด ก่อนการเผยแพร่รายงานที่สำคัญ ควรหลีกเลี่ยงการเข้าตลาดเพื่อป้องกันไม่ให้ถูกผลกระทบจากความผันผวนที่เพิ่มขึ้น หากตัดสินใจที่จะเทรดในช่วงการเผยแพร่ข่าว ควรวางคำสั่งหยุดขาดทุน (stop

Sebastian Seliga 12:08 2025-06-23 UTC+2

การวิเคราะห์ทางเทคนิคสำหรับสัปดาห์ที่ 23–28 มิถุนายน: คู่สกุลเงิน GBP/USD

ในสัปดาห์นี้ จากระดับราคา 1.3446 (ราคาปิดของแท่งเทียนรายสัปดาห์ที่ผ่านมา) ราคามีแนวโน้มที่จะลดลงต่อเนื่องสู่เป้าหมายที่ 1.3256 ซึ่งเป็นระดับการดึงกลับที่ 23.6% (เส้นประสีแดง) เมื่อทดสอบระดับนี้แล้ว ราคามีโอกาสเคลื่อนไหวขึ้นสู่ 13 EMA ที่ระดับ 1.3317

Stefan Doll 11:38 2025-06-23 UTC+2

การวิเคราะห์ทางเทคนิคสำหรับสัปดาห์ที่ 23–28 มิถุนายน: คู่สกุลเงิน EUR/USD

สัปดาห์นี้ จากระดับ 1.1520 (ปิดของเทียนรายสัปดาห์ล่าสุด) ตลาดอาจเริ่มเคลื่อนไหวลงไปสู่เป้าหมายที่ 1.1418 ซึ่งเป็นระดับหยุดพัก 14.6% (เส้นประสีน้ำเงิน) เมื่อลองทดสอบระดับนี้แล้ว ราคามีแนวโน้มที่จะดีดตัวขึ้นไปสู่ระดับหยุดพัก 76.4% ที่ 1.1452 (เส้นประสีแดง)

Stefan Doll 11:31 2025-06-23 UTC+2

การคาดการณ์สำหรับ EUR/USD ในวันที่ 23 มิถุนายน 2025

ในวันศุกร์ คู่เงิน EUR/USD ยังคงปรับตัวขึ้นหลังจากดีดตัวจากระดับการแก้ไข 76.4% ที่ 1.1454 อย่างไรก็ตาม ในคืนวันจันทร์ คู่เงินกลับมาที่ระดับนี้อีกครั้ง การดีดตัวใหม่ช่วยให้นักวิเคราะห์คาดหวังการเติบโตใหม่ของเงินยูโรไปยังระดับการแก้ไข 100.0% ที่ 1.1574 การที่อัตราของคู่เงินหากสามารถยืนอยู่ต่ำกว่า

Samir Klishi 11:24 2025-06-23 UTC+2

พยากรณ์สำหรับ GBP/USD ในวันที่ 23 มิถุนายน 2025

ในกราฟรายชั่วโมง คู่เงิน GBP/USD ในวันศุกร์ได้มีการรวมตัวต่ำกว่าพื้นที่สนับสนุนที่ 1.3425–1.3444 อีกครั้ง ซึ่งทำให้สามารถคาดหวังถึงการลดลงอย่างต่อเนื่องไปยังระดับสนับสนุนที่ 1.3357–1.3373 การดีดตัวจากโซนนี้หรือปิดเหนือระดับ 1.3425–1.3444 จะเป็นประโยชน์ต่อเงินปอนด์อังกฤษและการกลับมาเติบโตสู่ระดับ 127.2% Fibonacci ที่ 1.3527

Samir Klishi 11:19 2025-06-23 UTC+2

การวิเคราะห์ทางเทคนิคของการเคลื่อนไหวรายวันของคู่สกุลเงินแปลกใหม่ USD/IDR, วันจันทร์ที่ 23 มิถุนายน 2025

16473.27 ขณะนี้ในกราฟรายวัน คู่สกุลเงินหายาก USD/IDR มีรูปแบบ Bullish 123 ซึ่งบ่งชี้ว่า USD/IDR กำลังแข็งค่าขึ้น ซึ่งได้รับการยืนยันจากการเคลื่อนไหวของราคาของคู่สกุลเงินหายากนี้เหนือ WMA (21) ซึ่งยังลาดขึ้น ดังนั้นตราบใดที่ยังไม่มีการอ่อนค่าลงอีกที่จะทะลุและปิดต่ำกว่าระดับ

Arief Makmur 07:29 2025-06-23 UTC+2

การวิเคราะห์ทางเทคนิคของการเคลื่อนไหวของราคาน้ำมันดิบรายวัน จันทร์ที่ 23 มิถุนายน 2025

นอกเหนือจากการปรากฏขึ้นของ Divergence ระหว่างการเคลื่อนที่ของราคาน้ำมันดิบและอินดิเคเตอร์ Stochastic Oscillator บนกราฟ 4 ชั่วโมงแล้ว ยังมีรูปแบบ Bearish 123 และกราฟ Triangle ที่แสดงให้เห็นว่าในอนาคตอันใกล้นี้ #CL

Arief Makmur 07:29 2025-06-23 UTC+2
หากไม่สะดวกคุยในตอนนี้
ระบุคำถามไว้ได้ใน แชท.
Widget callback
 

Dear visitor,

Your IP address shows that you are currently located in the USA. If you are a resident of the United States, you are prohibited from using the services of InstaFintech Group including online trading, online transfers, deposit/withdrawal of funds, etc.

If you think you are seeing this message by mistake and your location is not the US, kindly proceed to the website. Otherwise, you must leave the website in order to comply with government restrictions.

Why does your IP address show your location as the USA?

  • - you are using a VPN provided by a hosting company based in the United States;
  • - your IP does not have proper WHOIS records;
  • - an error occurred in the WHOIS geolocation database.

Please confirm whether you are a US resident or not by clicking the relevant button below. If you choose the wrong option, being a US resident, you will not be able to open an account with InstaForex anyway.

We are sorry for any inconvenience caused by this message.