empty
20.03.2023 02:04 PM
Technical analysis of GBP/USD for March 20, 2023

This image is no longer relevant

Overview :

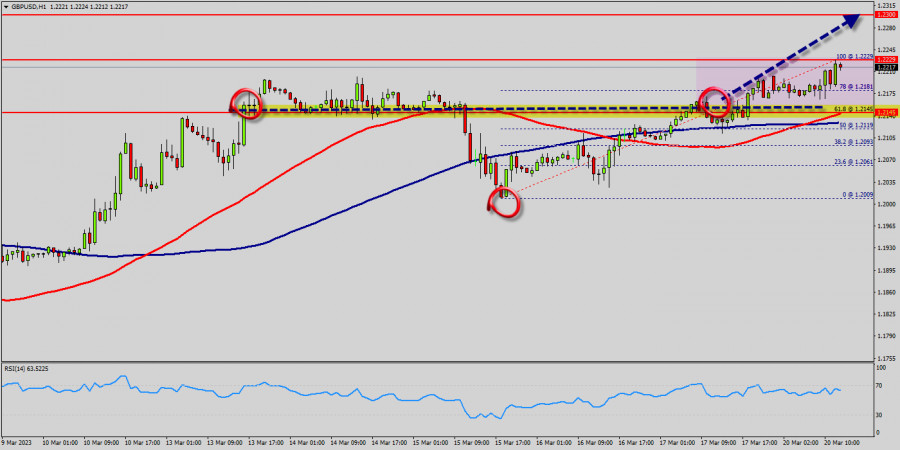
The GBP/USD pair traded higher and closed the day in the positive territory near the price of 1.2208. Right now, it was trading in a narrow range of 1.2150 staying close to a 2-days high. On the hourly chart, the GBP/USD pair is still trading above the MA (100) H1 moving average line (1.2068 - weekly pivot point). The situation is similar on the 4-hour chart. Based on the foregoing, it is probably worth sticking to the north direction in trading, and as long as the GBP/USD pair remains above MA 100 H1, it may be necessary to look for entry points to buy for the formation of a correction.

All elements being clearly bullish, it would be possible for traders to trade only long positions on the GBP/USD pair as long as the price remains well above the golden ratio of 1.2068. The buyers' bullish objective is set at 1.2209.

The price is likely to form a double top in the same time frame. Accordingly, the GBP/USD pair is showing signs of strength following a breakout of the highest level of 1.2209. So, buy above the level of 1.2068 with the first target at 1.2209 in order to test the daily resistance 1. The level of 1.2209 is a good place to take profits.

Moreover, the RSI is still signaling that the trend is upward as it remains strong above the moving average (100). This suggests that the pair will probably go up in coming hours. A bullish break in this resistance would boost the bullish momentum. Other outlook for the GBP/USD pair : Pound Sterling is currently trading at 1.2150. If the trend reverses from this point, then a possible future share price target could be 1.2209.

If the price of Pound Sterling is trading above 1.2150 then possibility of upside targets getting achieved is higher around the level of 1.2150. The basic bullish trend is very strong on the GBP/USD pair, but the short term shows some signs of running out of steam. Nevertheless, a purchase could be considered as long as the price remains above 1.2150.

Crossing the first resistance at 1.2209 would be a sign of a potential new surge in the price. Buyers would then use the next resistance located at 1.2270 as an objective. Crossing it would then enable buyers to target 1.2270. Caution, a return to below 1.2270 would be a sign of a consolidation phase in the short-term basic trend. If this is the case, remember that trading against the trend may be riskier.

It would seem more appropriate to wait for a signal indicating reversal of the trend. In the very short term, the general bullish sentiment is not called into question, despite technical indicators being indecisive. All elements being clearly bullish market, it would be possible for traders to trade only long positions on the GBP/USD pair as long as the price remains well above the price of 1.2068. The GBP/USD pair will continue rising from the level of 1.2068 in the long term.

It should be noted that the support is established at the level of 1.2068 which represents the last bearish wave. The price is likely to form a double bottom in the same time frame. Accordingly, the GBP/USD pair is showing signs of strength following a breakout of the highest level of 1.2068. So, buy above the level of 1.2068 with the first target at 1.2209 in order to test the daily resistance 1. The buyers' bullish objective is set at the level of 1.2270 (last bullish wave). A bullish break in this resistance would boost the bullish momentum.

The buyers could then target the resistance located at 1.2270 . This suggests that the pair will probably go up in coming hours. If the trend is able to break the level of 1.2209 (double top), then the market will call for a strong bullish market towards the objective of 1.2270 this week. If there is any crossing, the next objective would be the resistance located at 1.2270.

The level of 1.2270 is a good place to take profits. Moreover, the RSI is still signaling that the trend is upward as it remains strong above the moving average (100). Since the trend is above the 61.8% Fibonacci level (1.2068), it means the market is still in a uptrend. From this point, the GBP/USD pair is continuing in a bullish trend from the new support of 1.2068. This is shown to us as the current price is in a bullish channel.

According to the previous events, we expect that the GBP/USD pair will move between 1.2068 and 1.2270 in coming hours. It is also should be noted, beware of bullish excesses that could lead to a possible short-term correction; but this possible correction would not be tradeable.

On the other hand, in case a reversal takes place and the GBP/USD pair breaks through the support level of 1.2068, a further decline to 1.1981 can occur. It would indicate a bearish market.

เลือกช่วงเวลา
5
นาที
15
นาที
30
นาที
1
ชั่วโมง
4
ชั่วโมง
1
วัน
1
สัปดาห์
รับผลกำไรจากการเปลี่ยนแปลงอัตราสกุลเงินดิจิทัลกับ InstaForex.
ดาวน์โหลด MetaTrader 4 และเปิดการซื้อขายครั้งแรกของคุณ.
  • Grand Choice
    Contest by
    InstaForex
    InstaForex always strives to help you
    fulfill your biggest dreams.
    เข้าร่วมการแข่งขัน


บทความแนะนำ

พยากรณ์อัตราแลกเปลี่ยน วันที่ 26/06/2025: EUR/USD, USD/JPY, USDX, น้ำมัน และ Ethereum

ลิงก์ที่มีประโยชน์: บทความอื่น ๆ ของฉันสามารถดูได้ในส่วนนี้ คอร์ส InstaForex สำหรับผู้เริ่มต้น การวิเคราะห์ยอดนิยม เปิดบัญชีซื้อขาย สำคัญ: ผู้เริ่มต้นในตลาดแลกเปลี่ยนเงินตราต่างประเทศควรระมัดระวังอย่างมากเมื่อทำการตัดสินใจเกี่ยวกับการเข้าสู่ตลาด ก่อนที่จะมีการประกาศรายงานที่สำคัญ ควรหลีกเลี่ยงการเข้าตลาด เพื่อป้องกันไม่ให้เจอกับความผันผวนที่รุนแรงเนื่องจากความอ่อนไหวที่เพิ่มขึ้น หากคุณตัดสินใจที่จะทำการซื้อขายในระหว่างที่มีการเผยแพร่ข่าว

Sebastian Seliga 12:18 2025-06-26 UTC+2

EUR/USD – 26 มิถุนายน คำกล่าวของพาวเวลยังคงไม่เปลี่ยนแปลง

ในวันพุธ คู่สกุลเงิน EUR/USD ยังคงมีการเคลื่อนไหวขึ้น และเช้าวันพฤหัสบดีก็ได้ไปถึงระดับฟีโบนัชชี่ 127.2% ที่ 1.1712 การสะท้อนกลับจากระดับนี้อาจทำให้เกิดการกลับตัวในความโปรดปรานของดอลลาร์สหรัฐฯ และการลดลงสู่ระดับ 1.1645 และ 1.1574 หากคู่สกุลเงินสามารถยืนเหนือ 1.1712

Samir Klishi 11:17 2025-06-26 UTC+2

GBP/USD. 26 มิถุนายน. รายงาน GDP ของสหรัฐฯจะเปลี่ยนแปลงสิ่งใดไหม?

บนแผนภูมิรายชั่วโมง, คู่สกุลเงิน GBP/USD ในวันพุธได้รักษาตำแหน่งเหนือโซนความต้านทานที่ 1.3611–1.3633 และทำการเคลื่อนที่ขึ้นไปยังระดับ Fibonacci ถัดไป 200.0% ณ 1.3749 การตอบแทนแรงดันจากระดับนี้จะสนับสนุนดอลลาร์สหรัฐฯ และนำไปสู่การลดลงอย่างเป็นมาณพอ แต่หมียังคงหายจากตลาดอย่างมาก การรักษาอย่างเป็นทางการเหนือ

Samir Klishi 10:48 2025-06-26 UTC+2

ทองคำ: ทำไมราคาทองคำถึงกลับมาสูงขึ้นอีกครั้ง?

ทองคำกำลังได้รับแรงหนุนอีกครั้งจากปัจจัยหลักสองประการ ปัจจัยแรกคือความเสี่ยงอย่างต่อเนื่องของความล้มเหลวในการเจรจาระหว่างเตหะรานและเทลอาวีฟ ปัจจัยที่สองเกี่ยวข้องกับความอ่อนแอเรื้อรังของค่าเงินดอลลาร์สหรัฐ ในขณะที่เศรษฐกิจอเมริกากำลังเข้าสู่ภาวะถดถอย ซึ่งอาจยืดเยื้อไปอีกระยะเวลานาน และความไม่แน่นอนเกี่ยวกับผลกระทบระดับโลกในอนาคตของนโยบายภาษีศุลกากรของ Donald Trump ในเชิงเทคนิค ราคาทองคำยังคงอยู่ในแนวโน้มขาขึ้นระยะยาว แรงขับเคลื่อนที่เป็นขาขึ้นจากสาเหตุดังกล่าวอาจดำเนินต่อไปหลังจากที่เกิดการทะลุและยืนเหนือระดับ 3340.00 ราคากำลังเคลื่อนไหวอยู่เหนือเส้นกลางของ Bollinger Bands

Pati Gani 09:21 2025-06-26 UTC+2

คู่สกุลเงิน USD/CAD ยังคงอ่อนค่าลงแม้ว่าจะมีโอกาสในการทดสอบแนวต้านแบบไดนามิกอีกครั้งในวันพฤหัสบดีที่ 26 มิถุนายน 2025

USD/CAD – พฤหัสบดีที่ 26 มิถุนายน 2025 USD/CAD กำลังเคลื่อนไหวในแนวโน้มอ่อนค่าลง แม้ว่าจะมีศักยภาพในการฟื้นตัวเป็นบางช่วงในรูปแบบของการกลับตัวก็ตาม ระดับสำคัญ 1. แนวต้าน 2: 1.37724

Arief Makmur 05:11 2025-06-26 UTC+2

EUR/GBP มีโอกาสทดสอบแนวต้าน ระดับ 1 ก่อนกลับไปที่แนวโน้มเดิมในวันพฤหัสบดีที่ 26 มิถุนายน 2025

EUR/GBP – วันพฤหัสบดีที่ 26 มิถุนายน 2025 EUR/GBP กำลังเคลื่อนตัวในสภาวะอ่อนแอ แต่มีศักยภาพสำหรับการปรับแก้เป็นการแข็งแกร่ง ระดับสำคัญ 1. แนวต้านที่ 2: 0.85538

Arief Makmur 05:11 2025-06-26 UTC+2

การพยากรณ์ EUR/USD สำหรับวันที่ 26 มิถุนายน 2025

EUR/USD ข้อมูลยอดขายบ้านใหม่ในสหรัฐฯ สำหรับเดือนพฤษภาคมเมื่อวานนี้แย่กว่าที่คาดไว้ โดยมียอดขายอยู่ที่ 623,000 หน่วย เทียบกับที่คาดการณ์ไว้ที่ 694,000 หน่วย และตัวเลขในเดือนเมษายนถูกปรับลดลงจาก 743,000 หน่วยเป็น 722,000 หน่วย ส่งผลให้ยอดขายลดลง

Laurie Bailey 05:11 2025-06-26 UTC+2

การคาดการณ์ GBP/USD สำหรับวันที่ 26 มิถุนายน 2025

GBP/USD ด้วยการปรับตัวขึ้นอย่างแข็งแกร่งของเงินปอนด์อังกฤษในเช้าวันนี้ การยืนยันการยืนเหนือระดับ 1.3635 บนกราฟรายวันจึงถือว่าเกิดขึ้นแล้ว ซึ่งเปิดเส้นทางไปยังเป้าหมายที่ 1.3834 และ 1.3935 จากระดับใดในสองระดับที่กล่าวมานี้ที่การแก้ไขอย่างลึกอาจเริ่มขึ้น? ตามการประเมินแบบดั้งเดิมเกี่ยวกับแนวโน้มที่ยั่งยืนของเงินปอนด์ การกลับทิศทางมีแนวโน้มสูงสุดที่จะเริ่มจากระดับ 1.3935 อย่างไรก็ตาม ยังมีช่องราคาที่กว้างกว่า

Laurie Bailey 04:57 2025-06-26 UTC+2

การคาดการณ์ EUR/NZD สำหรับวันที่ 26 มิถุนายน 2025

EUR/NZD ในกราฟรายสัปดาห์ เส้นสัญญาณของตัวกำหนดออสซิลเลเตอร์ Marlin ได้หันขึ้นจากขอบเขตของโซนขาลง ครั้งสุดท้ายที่มีลักษณะเช่นเดียวกันนี้เกิดขึ้น (การเปลี่ยนแปลงก่อนหน้าในเดือนกุมภาพันธ์) ได้มีการนำไปสู่การปรับตัวขึ้น 7 สัปดาห์ที่มีมูลค่า 1,800 จุด เราไม่คาดว่าฉากเดิมจะเกิดขึ้นซ้ำทั้งหมด แต่ยังสามารถมีความเป็นไปได้ที่จะมีการเคลื่อนไหวขึ้นในช่วงกลาง อย่างไรก็ตาม

Laurie Bailey 04:57 2025-06-26 UTC+2

สัญญาณการซื้อขายสำหรับ EUR/USD วันที่ 25-28 มิถุนายน 2025: ขายต่ำกว่า 1.1645 (21 SMA - 7/8 Murray)

ในช่วงต้นของการซื้อขายในอเมริกา คู่เงิน EUR/USD กำลังซื้อขายอยู่ราวๆ 1.1623 ภายในช่องแนวโน้มขาขึ้นที่เกิดขึ้นตั้งแต่วันที่ 10 มิถุนายน และแสดงให้เห็นการฟื้นตัวเล็กน้อยหลังจากที่มีการยืนเหนือพื้นที่นี้ในไม่กี่วันที่ผ่านมา ยูโรมีแนวต้านที่แข็งแกร่งอยู่ราว 1.1640 โดยทางเทคนิคบริเวณนี้ได้กดดันราคายูโรให้เคลื่อนตัวลงในไม่กี่วันที่ผ่านมา ในขณะนี้ EUR/USD อยู่ภายในช่องแนวโน้มขาขึ้นที่ทำหน้าที่เป็นแนวต้าน

Dimitrios Zappas 18:35 2025-06-25 UTC+2
หากไม่สะดวกคุยในตอนนี้
ระบุคำถามไว้ได้ใน แชท.
Widget callback
 

Dear visitor,

Your IP address shows that you are currently located in the USA. If you are a resident of the United States, you are prohibited from using the services of InstaFintech Group including online trading, online transfers, deposit/withdrawal of funds, etc.

If you think you are seeing this message by mistake and your location is not the US, kindly proceed to the website. Otherwise, you must leave the website in order to comply with government restrictions.

Why does your IP address show your location as the USA?

  • - you are using a VPN provided by a hosting company based in the United States;
  • - your IP does not have proper WHOIS records;
  • - an error occurred in the WHOIS geolocation database.

Please confirm whether you are a US resident or not by clicking the relevant button below. If you choose the wrong option, being a US resident, you will not be able to open an account with InstaForex anyway.

We are sorry for any inconvenience caused by this message.