empty
02.10.2023 10:49 AM
Weekly forecast based on simplified wave analysis for GBP/USD, AUD/USD, USD/CHF, EUR/JPY, and US dollar index from October 2nd

GBP/USD

Brief Analysis:

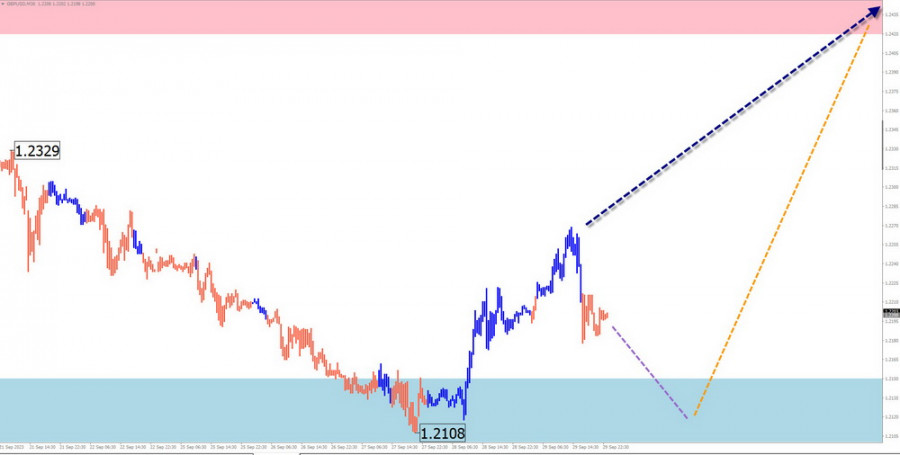
The major of the British pound has been pushing the pair's quotes down on the price chart since mid-July. The price has reached the upper boundary of a potentially reversal zone. Last week, a corrective phase began to form on the chart, which has not yet been completed.

Weekly Forecast:

At the beginning of the upcoming week, there is likely to be a repeat decline in the price of the British currency to the calculated support levels. Afterwards, we can expect a reversal to form. By the end of the week, we can anticipate the beginning of an upward price movement. The resistance zone represents the maximum expected upper boundary of the weekly range for the pair.

This image is no longer relevant

Potential Reversal Zones

Resistance:

  • 1.2420/1.2470

Support:

  • 1.2150/1.2100

Recommendations

Selling: Can be used within individual sessions with a reduced lot size. The downside potential is limited by the support zone.

Buying: Will become relevant after the appearance of corresponding signals from your trading systems in the support zone.

AUD/USD

Brief Analysis:

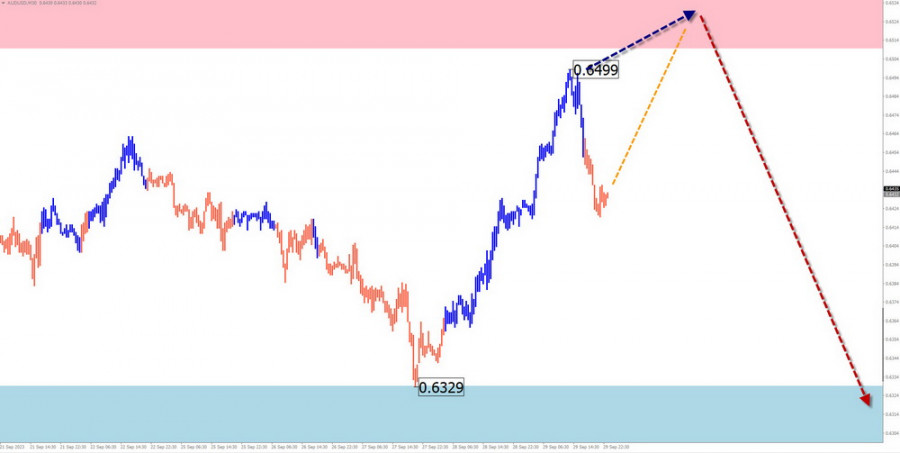
A descending trend dominates the market for the major Australian dollar pair. The count has been underway since July 14th. The price has closely approached the upper boundary of a potentially reversal zone over a large time frame. Over the past two months, the price has formed a correction along this boundary in the form of a stretched flat. The structure of the entire wave is nearing completion.

Weekly Forecast:

In the upcoming week, we expect the continuation of the Aussie's price movement within the corridor between the nearest zones of opposing directions. After potential pressure on the resistance zone at the beginning of the week, we can expect a reversal and a price rollback to the support zone. When the direction changes, a brief breach of the upper boundary of the zone is not excluded.

This image is no longer relevant

Potential Reversal Zones

Resistance:

  • 0.6510/0.6560

Support:

  • 0.6330/0.6280

Recommendations

Selling: Will be possible after the appearance of confirmed signals in the support zone.

Buying: Can be used with a reduced lot size within intraday trading. The resistance places a limit on the potential.

USD/CHF

Brief Analysis:

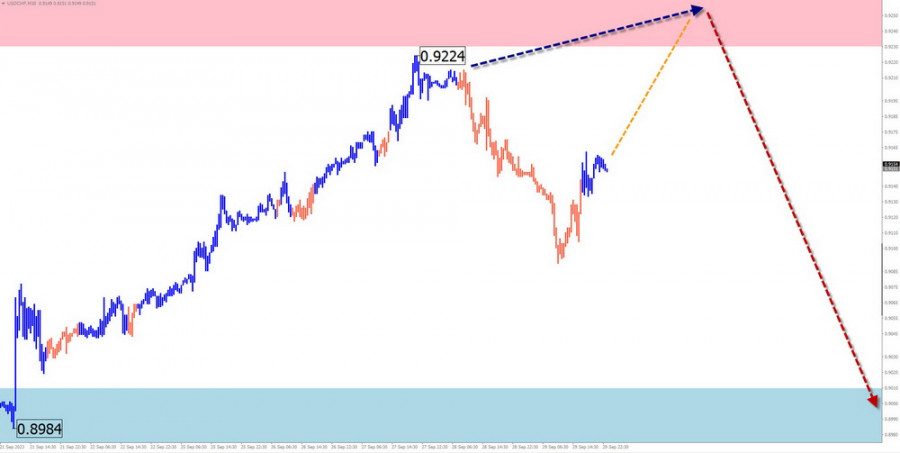
On the chart of the major Swiss franc pair, the ascending wave that started in mid-July continues to dominate. The quotes have come close to the lower boundary of a powerful reversal zone on a monthly scale chart. However, the wave structure does not indicate completion. There are no signals of an imminent change in course as of yet.

Weekly Forecast:

After a likely attempt to exert pressure on the resistance zone in the coming days, the pair's price is expected to move mainly sideways. With a high probability, we can then expect a reversal and the beginning of a price decline. When the course changes, a brief breach of the upper boundary of the resistance zone is not excluded.

This image is no longer relevant

Potential Reversal Zones

Resistance:

  • 0.9230/0.9280

Support:

  • 0.9010/0.8960

Recommendations

Buying: Due to the limited potential, there is a high probability of deposit loss.

Selling: Fractional lots can be used after the appearance of corresponding signals from your trading systems in the resistance zone.

EUR/JPY

Brief Analysis:

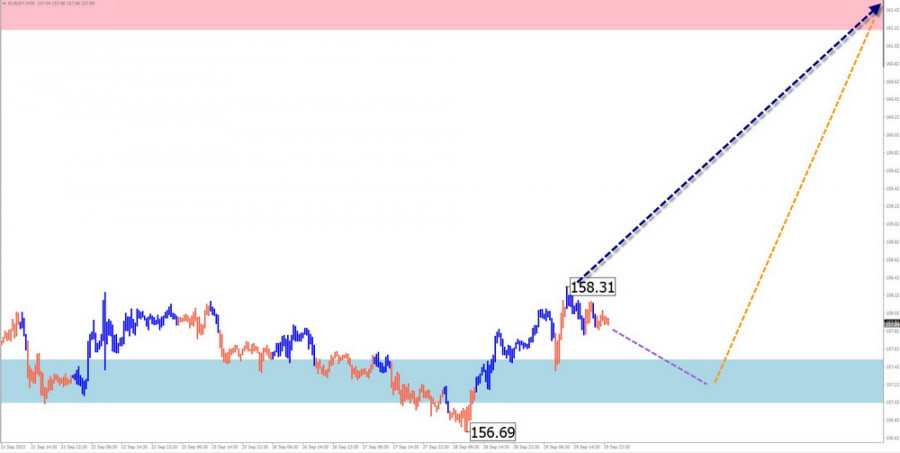
As of the analysis moment, the ascending wave pattern for the euro/yen chart started on July 28th. Over the past month and a half, a flat correction has been developing within it on a horizontal plane. The wave is not yet complete at the time of analysis. After the full completion of the retracement, the bullish trend of the pair will continue.

Weekly Forecast:

At the beginning of the upcoming week, the pair's price is expected to move sideways along the boundaries of the support zone. By the end of the week, a reversal and the resumption of the price ascent can be expected.

This image is no longer relevant

Potential Reversal Zones

Resistance:

  • 161.20/161.70

Support:

  • 157.50/157.00

Recommendations

Selling: Possible within intraday trading with fractional lots. The potential for trade is limited by support.

Buying: After the appearance of confirmed reversal signals in the support zone, they may be recommended as the main direction for trading.

USDollar Index

Brief Analysis:

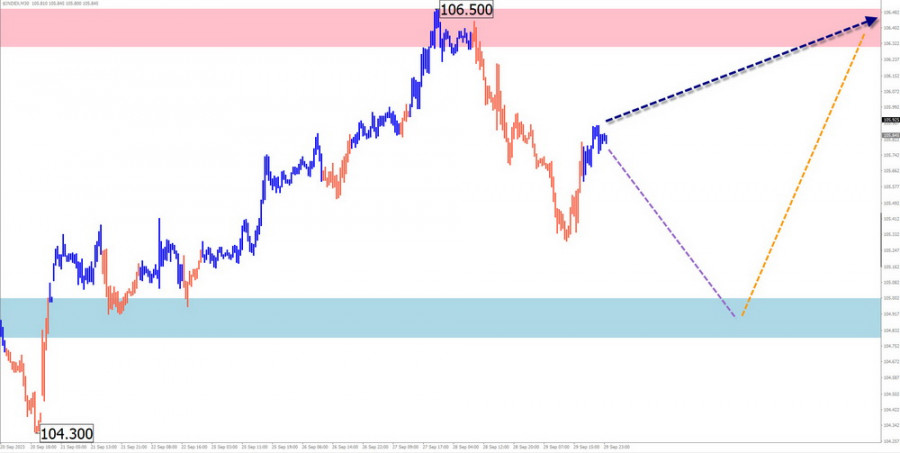
The short-term bullish trend of the US dollar, which started in mid-July, continues. The quotes have reached the lower boundary of a potentially reversal zone on the daily time frame. The wave structure does not indicate completion. At the end of the last week, a descending segment began to form.

Weekly Forecast:

In the first half of the upcoming week, a general sideways movement of the index is most likely. A downward vector is possible, with a decrease not below the support zone area. Afterward, the dollar's rate is expected to resume its ascent.

This image is no longer relevant

Potential Reversal Zones

Resistance:

  • 106.30/106.50

Support:

  • 105.00/104.80

Recommendations

Placing bets on the dollar's continued growth in the near future is risky and may lead to deposit losses. The optimal tactic will be to refrain from trading in major pairs until signals of the dollar's rate increase appear.

Notes: In simplified wave analysis (SWA), all waves consist of three parts (A, B, and C). In each time frame, the latest, unfinished wave is analyzed. Dashed lines indicate expected movements.

Attention: The wave algorithm does not take into account the duration of instrument movements in time!

Summary
Urgency
Analytic
Vyacheslav Ognev
Start trade
รับผลกำไรจากการเปลี่ยนแปลงอัตราสกุลเงินดิจิทัลกับ InstaForex.
ดาวน์โหลด MetaTrader 4 และเปิดการซื้อขายครั้งแรกของคุณ.
  • Grand Choice
    Contest by
    InstaForex
    InstaForex always strives to help you
    fulfill your biggest dreams.
    เข้าร่วมการแข่งขัน


บทความแนะนำ

การวิเคราะห์ GBP/USD วันที่ 30 กรกฎาคม 2025

รูปแบบคลื่นของคู่สกุลเงิน GBP/USD ยังคงบ่งชี้ถึงการก่อตัวของคลื่นขับเคลื่อนขึ้นตามแนวโน้มขาขึ้น รูปแบบคลื่นนี้มีความคล้ายคลึงกับคู่สกุลเงิน EUR/USD เนื่องจากดอลลาร์ยังคงเป็นตัวขับเคลื่อนหลักของพลวัตตลาดในขณะนี้ ความต้องการดอลลาร์ในตลาดที่ลดลงในระยะกลางทำให้เครื่องมือหลายชนิดแสดงแนวโน้มคล้ายกัน ในปัจจุบัน, รูปแบบคลื่นแก้ไขกำลังพัฒนาเป็นส่วนหนึ่งของคลื่น 4 หากข้อสมมติฐานนี้ถูกต้อง การลดลงของเครื่องมืออาจสิ้นสุดลงในไม่ช้า เนื่องจากโครงสร้างได้ก่อตัวเป็นรูปแบบสามคลื่นคลาสสิก เป็นสิ่งสำคัญที่ต้องทราบว่า สิ่งต่าง

Chin Zhao 21:04 2025-07-30 UTC+2

การวิเคราะห์ EUR/USD ในวันที่ 30 กรกฎาคม 2025

รูปแบบของคลื่นบนกราฟ 4 ชั่วโมงสำหรับ EUR/USD ยังคงไม่เปลี่ยนแปลงมาหลายเดือน ส่วนแนวโน้มขาขึ้นยังคงดำเนินต่อไป ในขณะที่พื้นฐานข่าวไม่ได้สนับสนุนดอลลาร์สหรัฐอย่างมาก สงครามการค้าที่ Donald Trump เริ่มต้นขึ้นมีเป้าหมายเพื่อเพิ่มรายได้ของงบประมาณและกำจัดขาดดุลการค้า อย่างไรก็ตาม เป้าหมายเหล่านี้ยังไม่สำเร็จ ข้อตกลงการค้ามีการลงนามอย่างยากลำบาก และกฎหมาย

Chin Zhao 20:54 2025-07-30 UTC+2

EUR/USD ในวันที่ 29 กรกฎาคม: ฝ่ายซื้อมุ่งมั่นที่จะผลักดันตลาดไปสู่ระดับ 1.189

ในระยะยาว ตลาด EUR/USD อาจก่อตัวทำการปรับฐานขาขึ้นใหญ่ (B) ซึ่งมีลักษณะของรูปแบบ A-B-C zigzag มาตรฐาน ขณะนี้มีเพียงสองส่วนแรกของรูปแบบนี้ที่เสร็จสิ้นสมบูรณ์แล้ว ซึ่งได้แก่ คลื่นแรงกระตุ้น A และคลื่นปรับฐาน

Roman Onegin 18:32 2025-07-29 UTC+2

การวิเคราะห์ GBP/USD เมื่อวันที่ 28 กรกฎาคม 2025

ลักษณะคลื่นสำหรับ GBP/USD ยังคงบ่งบอกถึงการก่อตัวของโครงสร้างคลื่นขาขึ้น ลักษณะคลื่นนี้เกือบจะเหมือนกับ EUR/USD เนื่องจากปัจจัยสำคัญจริงๆ ยังคงเป็นดอลลาร์สหรัฐฯ การความต้องการดอลลาร์ลดลงโดยรวม ทำให้เครื่องมือต่างๆ แสดงพฤติกรรมที่คล้ายคลึงกัน คลื่นที่ 2 ของแนวโน้มขาขึ้นมีรูปแบบเป็นคลื่นเดียว คลื่นที่

Chin Zhao 21:13 2025-07-28 UTC+2

การวิเคราะห์ EUR/USD วันที่ 28 กรกฎาคม 2025

รูปแบบคลื่นบนกราฟ EUR/USD ระยะเวลา 4 ชั่วโมงยังคงไม่เปลี่ยนแปลงมาหลายเดือนแล้ว ส่วนของแนวโน้มขาขึ้นยังคงพัฒนาอยู่ ในขณะที่ข่าวพื้นฐานยังคงสนับสนุนทุกสกุลเงินยกเว้นดอลลาร์ สงครามการค้าที่ Donald Trump เริ่มขึ้นมีเป้าหมายเพื่อเพิ่มรายได้ของรัฐและขจัดการขาดดุลการค้า อย่างไรก็ตามยังไม่บรรลุเป้าหมายเหล่านี้ การทำข้อตกลงการค้าเป็นไปอย่างยากลำบาก และ "กฎหมายใหญ่หนึ่งฉบับ"

Chin Zhao 21:06 2025-07-28 UTC+2

การพยากรณ์ประจำสัปดาห์โดยอิงจากการวิเคราะห์คลื่นแบบง่ายสำหรับ GBP/USD, AUD/USD, USD/CHF, EUR/JPY, AUD/JPY และดัชนี USDollar — วันที่ 28 กรกฎาคม

GBP/USD การวิเคราะห์: สกุลเงินปอนด์อังกฤษยังคงเคลื่อนไหวอยู่ในส่วนบนของกราฟราคา สอดคล้องกับแนวโน้มขาขึ้นที่มีอยู่ตลอดทั้งเดือน ราคามีการปรับฐานจากโซนแนวต้านที่แข็งแกร่ง โครงสร้างของคลื่นคล้ายกับรูปแบบ contracting flat และยังไม่เสร็จสมบูรณ์ในขณะที่ทำการวิเคราะห์ การคาดการณ์: คาดว่าคู่นี้จะยังคงมีการปรับฐานลงในพื้นที่แนวรับ การเคลื่อนไหวแบบด้านข้างพร้อมกับการทดสอบแนวต้านตลอดต้นสัปดาห์อาจเกิดขึ้นได้ การกลับตัวและการอ่อนตัวต่ออาจเกิดขึ้นในช่วงปลายสัปดาห์ โซนที่อาจกลับทิศทาง: แนวต้าน

Isabel Clark 08:25 2025-07-28 UTC+2

การคาดการณ์รายสัปดาห์ตามการวิเคราะห์คลื่นที่เรียบง่ายสำหรับ EUR/USD, USD/JPY, GBP/JPY, USD/CAD, NZD/USD, GOLD ณ วันที่ 28 กรกฎาคม

การวิเคราะห์: คู่เงินหลักยูโรยังคงอยู่ในแนวโน้มขาขึ้น โดยช่วงนี้อยู่ในระยะแก้ไขซึ่งเริ่มต้นตั้งแต่ต้นเดือนกรกฎาคม ราคายังคงอยู่ระหว่างกลุ่มของระดับกลับตัวในศักยภาพบนหลายกรอบเวลา ในช่วงสองสัปดาห์ที่ผ่านมา ราคามีการก่อตัวของช่วงขาขึ้นซึ่งยังคงอยู่ภายในขอบเขตของการแก้ไขคลื่นปัจจุบัน การคาดการณ์: ในสัปดาห์หน้า คาดว่าการเคลื่อนไหวในแนวขนานจะดำเนินต่อไปภายในโซนที่ใกล้ที่สุด เริ่มแรกคู่เงินอาจขึ้นสู่ขอบเขตของแนวต้าน และในช่วงท้ายสัปดาห์มีแนวโน้มที่ราคาจะมีการกลับตัวและเริ่มต้นปรับตัวลง โซนที่มีโอกาสกลับตัว: แนวต้าน: 1.1810

Isabel Clark 00:48 2025-07-28 UTC+2

การวิเคราะห์ GBP/USD เมื่อวันที่ 24 กรกฎาคม 2025

รูปแบบคลื่นสำหรับคู่ GBP/USD ยังคงแสดงถึงการก่อตัวของรูปแบบคลื่นที่เป็นคลื่นขาขึ้น รูปภาพของคลื่นเกือบจะเหมือนกับ EUR/USD เนื่องจากค่าเงินดอลลาร์สหรัฐยังคงเป็นตัวขับเคลื่อนหลักของแนวโน้มตลาดในปัจจุบัน ความต้องการใช้ดอลลาร์ลดลงทั่วกระดาน ทำให้เครื่องมือหลายตัวแสดงพฤติกรรมแบบเดียวกัน คลื่น 2 ของแนวโน้มขาขึ้นมีลักษณะเป็นคลื่นเดียว คลื่นที่ 3 ที่คาดการณ์ไว้มีความสมบูรณ์และน่าเชื่อถือ ดังนั้นฉันคาดการณ์ถึงการก่อตัวของโครงสร้างการปรับฐาน

Chin Zhao 20:17 2025-07-24 UTC+2

การวิเคราะห์ EUR/USD ประจำวันที่ 24 กรกฎาคม 2025

รูปแบบคลื่นบนกราฟ EUR/USD ราย 4 ชั่วโมงยังคงไม่เปลี่ยนแปลงเป็นเวลาหลายเดือน ส่วนขาขึ้นของแนวโน้มยังคงพัฒนา และข่าวส่วนใหญ่ยังคงสนับสนุนทุกค่าเงินยกเว้นดอลลาร์สหรัฐ สงครามการค้าที่ย่อมเล็กได้โดย Donald Trump ถูกตั้งใจให้นำไปสู่รายได้งบประมาณที่เพิ่มสูงขึ้นและกำจัดการขาดดุลในการค้า อย่างไรก็ตาม เป้าหมายเหล่านี้ยังไม่ประสบความสำเร็จ การเจรจาการค้ามีความยากลำบาก และกฎหมาย

Chin Zhao 20:00 2025-07-24 UTC+2

การวิเคราะห์ GBP/USD ณ วันที่ 23 กรกฎาคม 2025

รูปแบบคลื่นสำหรับ GBP/USD ยังคงบ่งชี้ถึงการก่อตัวของโครงสร้างคลื่นขาขึ้นที่มีแรงกระทบ คลื่นภาพมีลักษณะเกือบเหมือนกันกับ EUR/USD เพราะว่าดอลลาร์สหรัฐยังคงเป็นปัจจัยเดียวที่ขับเคลื่อนตลาด ความต้องการสำหรับดอลลาร์กำลังลดลงทั่วทุกฝ่าย ทำให้เครื่องมือหลายตัวมีพฤติกรรมคล้ายคลึงกัน คลื่นที่ 2 ของช่วงแนวโน้มขาขึ้นได้นำเสนอในรูปแบบของคลื่นเดี่ยว คลื่นที่ 3 ที่สมมุติดูแข็งแกร่งและสมบูรณ์ ดังนั้นฉันคาดว่าจะมีการก่อตัวของโครงสร้างที่ต้องแก้ไขอยู่

Chin Zhao 20:25 2025-07-23 UTC+2
หากไม่สะดวกคุยในตอนนี้
ระบุคำถามไว้ได้ใน แชท.
Widget callback
 

Dear visitor,

Your IP address shows that you are currently located in the USA. If you are a resident of the United States, you are prohibited from using the services of InstaFintech Group including online trading, online transfers, deposit/withdrawal of funds, etc.

If you think you are seeing this message by mistake and your location is not the US, kindly proceed to the website. Otherwise, you must leave the website in order to comply with government restrictions.

Why does your IP address show your location as the USA?

  • - you are using a VPN provided by a hosting company based in the United States;
  • - your IP does not have proper WHOIS records;
  • - an error occurred in the WHOIS geolocation database.

Please confirm whether you are a US resident or not by clicking the relevant button below. If you choose the wrong option, being a US resident, you will not be able to open an account with InstaForex anyway.

We are sorry for any inconvenience caused by this message.