


signal strength 1 of 5
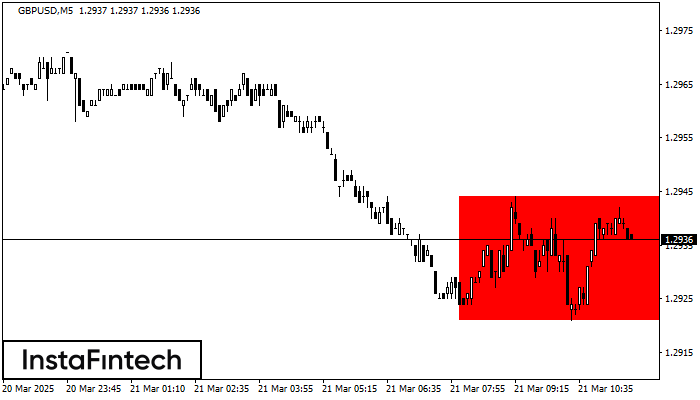
According to the chart of M5, GBPUSD formed the Bearish Rectangle. The pattern indicates a trend continuation. The upper border is 1.2944, the lower border is 1.2921. The signal means that a short position should be opened after fixing a price below the lower border 1.2921 of the Bearish Rectangle.
The M5 and M15 time frames may have more false entry points.
ดูเพิ่มเติม
- All
- Double Top
- Flag
- Head and Shoulders
- Pennant
- Rectangle
- Triangle
- Triple top
- All
- #AAPL
- #AMZN
- #Bitcoin
- #EBAY
- #FB
- #GOOG
- #INTC
- #KO
- #MA
- #MCD
- #MSFT
- #NTDOY
- #PEP
- #TSLA
- #TWTR
- AUDCAD
- AUDCHF
- AUDJPY
- AUDUSD
- EURCAD
- EURCHF
- EURGBP
- EURJPY
- EURNZD
- EURRUB
- EURUSD
- GBPAUD
- GBPCHF
- GBPJPY
- GBPUSD
- GOLD
- NZDCAD
- NZDCHF
- NZDJPY
- NZDUSD
- SILVER
- USDCAD
- USDCHF
- USDJPY
- USDRUB
- All
- M5
- M15
- M30
- H1
- D1
- All
- Buy
- Sale
- All
- 1
- 2
- 3
- 4
- 5
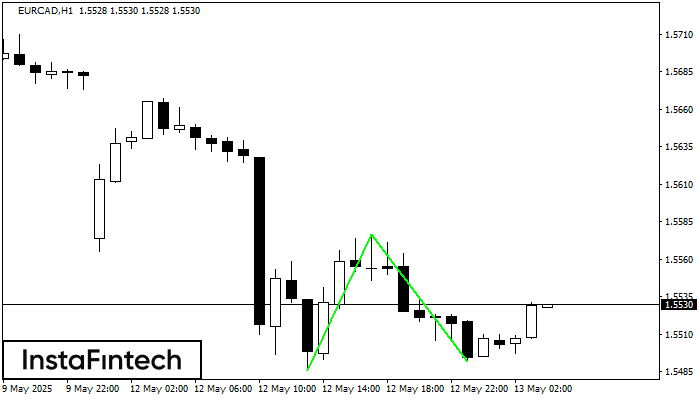
The Double Bottom pattern has been formed on EURCAD H1; the upper boundary is 1.5576; the lower boundary is 1.5492. The width of the pattern is 90 points. In case
Open chart in a new window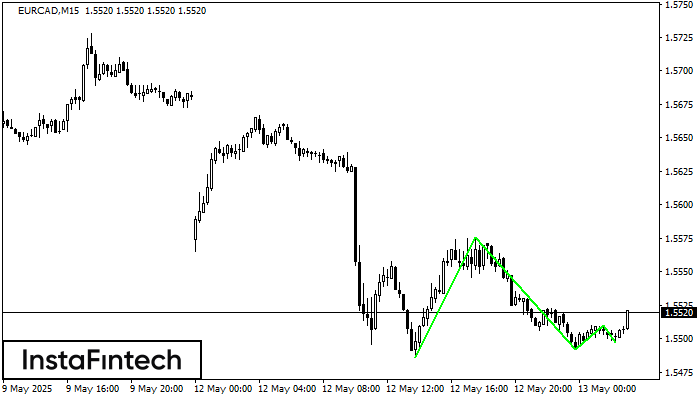
The Triple Bottom pattern has been formed on EURCAD M15. It has the following characteristics: resistance level 1.5576/1.5510; support level 1.5486/1.5497; the width is 90 points. In the event
The M5 and M15 time frames may have more false entry points.
Open chart in a new window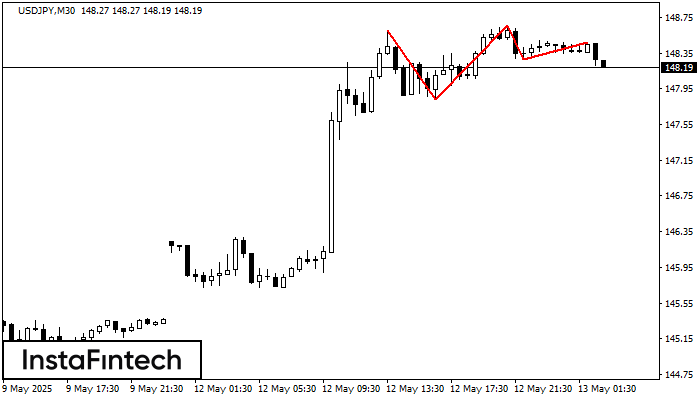
On the chart of the USDJPY M30 trading instrument, the Triple Top pattern that signals a trend change has formed. It is possible that after formation of the third peak
Open chart in a new window


