


signal strength 1 of 5
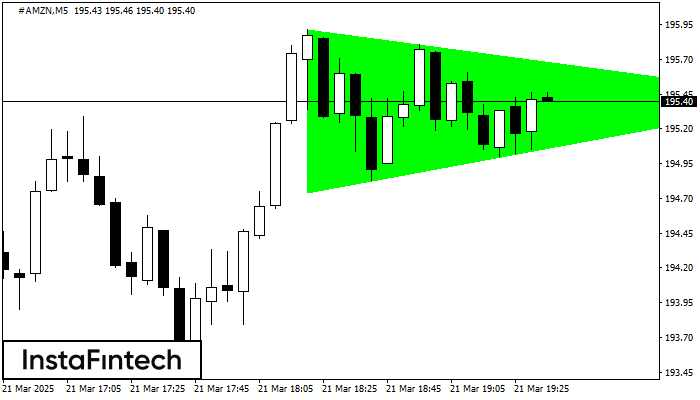
According to the chart of M5, #AMZN formed the Bullish Symmetrical Triangle pattern. The lower border of the pattern touches the coordinates 194.75/195.42 whereas the upper border goes across 195.92/195.42. If the Bullish Symmetrical Triangle pattern is in progress, this evidently signals a further upward trend. In other words, in case the scenario comes true, the price of #AMZN will breach the upper border to head for 195.57.
The M5 and M15 time frames may have more false entry points.
ดูเพิ่มเติม
- All
- Double Top
- Flag
- Head and Shoulders
- Pennant
- Rectangle
- Triangle
- Triple top
- All
- #AAPL
- #AMZN
- #Bitcoin
- #EBAY
- #FB
- #GOOG
- #INTC
- #KO
- #MA
- #MCD
- #MSFT
- #NTDOY
- #PEP
- #TSLA
- #TWTR
- AUDCAD
- AUDCHF
- AUDJPY
- AUDUSD
- EURCAD
- EURCHF
- EURGBP
- EURJPY
- EURNZD
- EURRUB
- EURUSD
- GBPAUD
- GBPCHF
- GBPJPY
- GBPUSD
- GOLD
- NZDCAD
- NZDCHF
- NZDJPY
- NZDUSD
- SILVER
- USDCAD
- USDCHF
- USDJPY
- USDRUB
- All
- M5
- M15
- M30
- H1
- D1
- All
- Buy
- Sale
- All
- 1
- 2
- 3
- 4
- 5
was formed on 09.05 at 22:57:29 (UTC+0)
signal strength 1 of 5

อ้างอิงจากชาร์ตของ M5, GBPJPY ที่ได้สร้างรูปแบบ รูปแบบกราฟสี่เหลี่ยมผืนผ้าขาขึ้น (Bullish Rectangle) ออกมา รูปแบบนี้แสดงถึง ความต่อเนื่องในแนวโน้ม ขอบเขตด้านบนคือ 193.44 ส่วน ขอบเขตด้านล่างคือ 193.24
ขอบเตระยะเวลาใน M5 และ M15 อาจจะมีตำแหน่งการเข้าใช้งานที่ผิดพลาดมากยิ่งขึ้น
Open chart in a new windowwas formed on 09.05 at 22:35:52 (UTC+0)
signal strength 1 of 5

รูปแบบ รูปแบบกราฟจุดสามยอดขาลง (Triple Bottom) ได้สร้างขึ้นมาในชาร์ตของ EURNZD M5 ที่เป็นตราสารการซื้อขาย รูปแบบนี้แสดงถึงการเปลี่่ยนแปลงในแนวโน้มจากแนวโน้มขาลง ไปเป็นแนวโน้มขาขึ้น ในกรณีที่มีการเคลื่อนตัวทะลุผ่านที่ 1.9038/1.9031
ขอบเตระยะเวลาใน M5 และ M15 อาจจะมีตำแหน่งการเข้าใช้งานที่ผิดพลาดมากยิ่งขึ้น
Open chart in a new window
รูปแบบการย้อนตัว รูปแบบกราฟจุดสองยอด (Double Top) ได้ถูกสร้างขึ้นมาใน #Bitcoin M5 คุณลักษณะ: ขอบเขตด้านบน 103337.20; ขอบเขตด้านล่าง 102845.36; ความกว้างของกราฟรูปแบบนี้คือ 51954 จุด
ขอบเตระยะเวลาใน M5 และ M15 อาจจะมีตำแหน่งการเข้าใช้งานที่ผิดพลาดมากยิ่งขึ้น
Open chart in a new window


