

signal strength 4 of 5

According to the chart of H1, EURNZD formed the Bullish Symmetrical Triangle pattern. Description: This is the pattern of a trend continuation. 2.0005 and 1.9118 are the coordinates of the upper and lower borders respectively. The pattern width is measured on the chart at 887 pips. Outlook: If the upper border 2.0005 is broken, the price is likely to continue its move by 1.9525.
- All
- Double Top
- Flag
- Head and Shoulders
- Pennant
- Rectangle
- Triangle
- Triple top
- All
- #AAPL
- #AMZN
- #Bitcoin
- #EBAY
- #FB
- #GOOG
- #INTC
- #KO
- #MA
- #MCD
- #MSFT
- #NTDOY
- #PEP
- #TSLA
- #TWTR
- AUDCAD
- AUDCHF
- AUDJPY
- AUDUSD
- EURCAD
- EURCHF
- EURGBP
- EURJPY
- EURNZD
- EURRUB
- EURUSD
- GBPAUD
- GBPCHF
- GBPJPY
- GBPUSD
- GOLD
- NZDCAD
- NZDCHF
- NZDJPY
- NZDUSD
- SILVER
- USDCAD
- USDCHF
- USDJPY
- USDRUB
- All
- M5
- M15
- M30
- H1
- D1
- All
- Buy
- Sale
- All
- 1
- 2
- 3
- 4
- 5
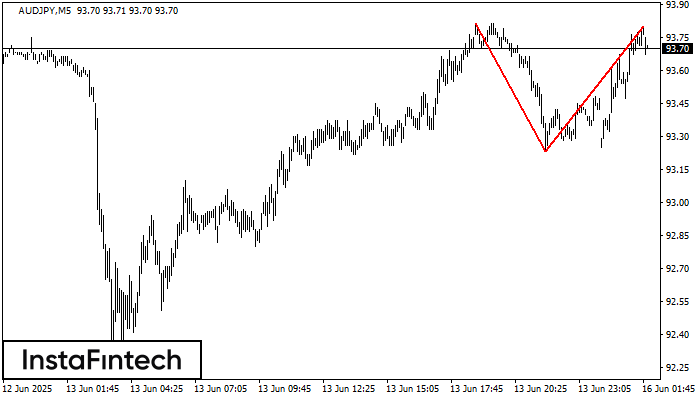
The Double Top reversal pattern has been formed on AUDJPY M5. Characteristics: the upper boundary 93.81; the lower boundary 93.23; the width of the pattern is 57 points. Sell trades
The M5 and M15 time frames may have more false entry points.
Open chart in a new window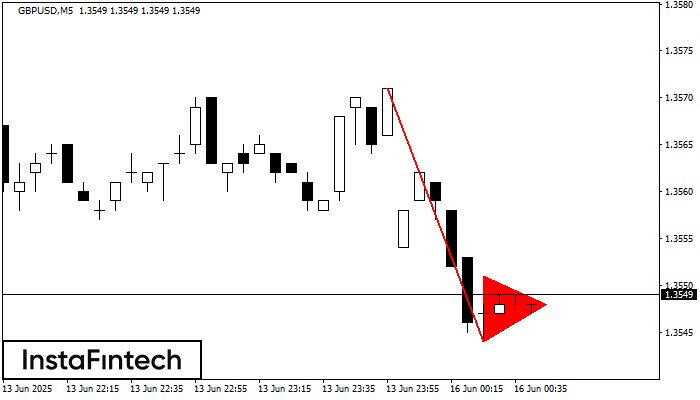
The Bearish pennant pattern has formed on the GBPUSD M5 chart. This pattern type is characterized by a slight slowdown after which the price will move in the direction
The M5 and M15 time frames may have more false entry points.
Open chart in a new window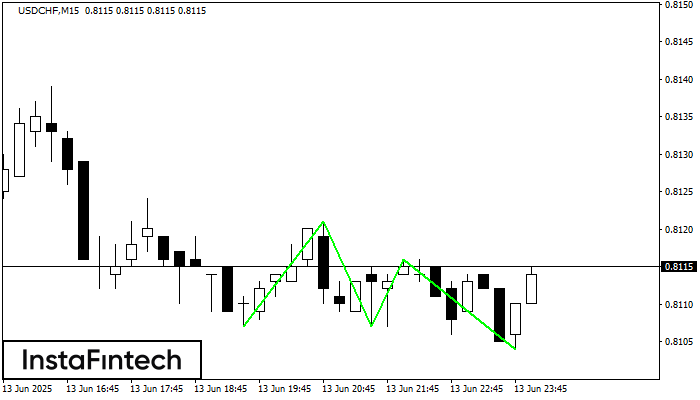
The Triple Bottom pattern has formed on the chart of USDCHF M15. Features of the pattern: The lower line of the pattern has coordinates 0.8121 with the upper limit 0.8121/0.8116
The M5 and M15 time frames may have more false entry points.
Open chart in a new window


