


сила сигнала 1 из 5
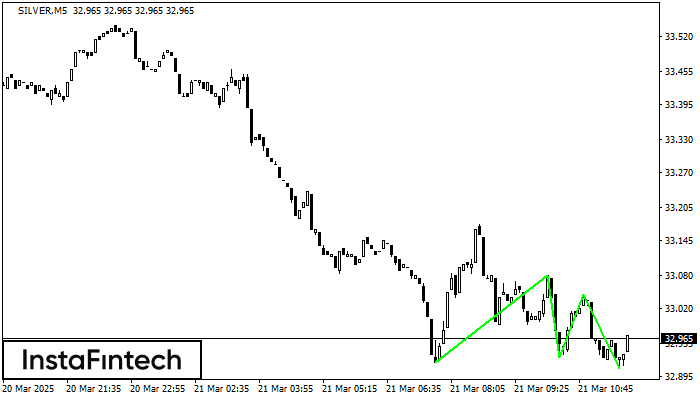
По SILVER на M5 сформировалась фигура «Тройное дно». Характеристика: Нижняя граница фигуры имеет координаты 32.91, при этом верхняя граница 33.08/33.05. Проекция ширины 150 пунктов. Формирование фигуры «Тройное дно» наиболее вероятным образом свидетельствует об изменении тренда с нисходящего на восходящий. Это означает, что в случае пробоя нижней границы 32.91 курс, с наибольшей вероятностью, продолжит восходящее движение.
Таймфреймы М5 и М15 могут иметь больше ложных точек входа.
- Все
- Вымпел
- Голова и плечи
- Двойная вершина
- Прямоугольник
- Треугольник
- Тройная вершина
- Флаг
- Все
- #AAPL
- #AMZN
- #Bitcoin
- #EBAY
- #FB
- #GOOG
- #INTC
- #KO
- #MA
- #MCD
- #MSFT
- #NTDOY
- #PEP
- #TSLA
- #TWTR
- AUDCAD
- AUDCHF
- AUDJPY
- AUDUSD
- EURCAD
- EURCHF
- EURGBP
- EURJPY
- EURNZD
- EURRUB
- EURUSD
- GBPAUD
- GBPCHF
- GBPJPY
- GBPUSD
- GOLD
- NZDCAD
- NZDCHF
- NZDJPY
- NZDUSD
- SILVER
- USDCAD
- USDCHF
- USDJPY
- USDRUB
- Все
- M5
- M15
- M30
- H1
- D1
- Все
- Покупка
- Продажа
- Все
- 1
- 2
- 3
- 4
- 5
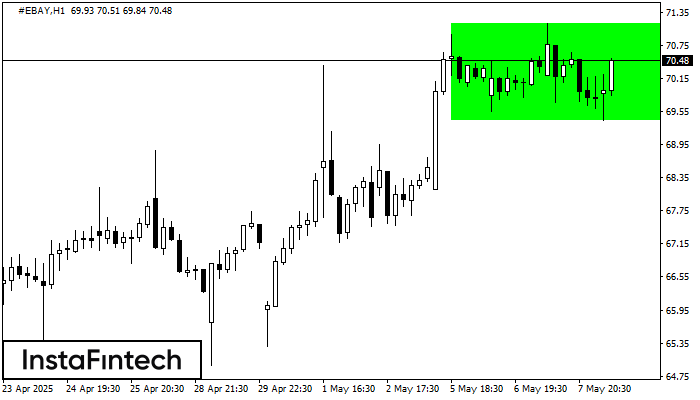
По торговому инструменту #EBAY на H1 сформировалась фигура продолжения тренда - «Прямоугольник». Фигура имеет границы: Нижняя 69.39; Верхняя 71.15. В случае пробоя верхней границы вероятно дальнейшее движение в сторону тренда
Открыть график инструмента в новом окне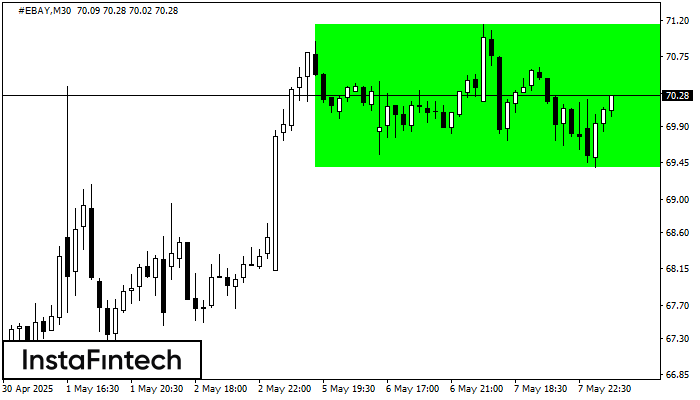
Сформирована фигура «Прямоугольник» на графике #EBAY M30. Тип фигуры: Продолжение тренда; Границы: Верхняя 71.15, Нижняя 69.39; Сигнал: позицию на покупку следует открывать выше верхней границы прямоугольника 71.15
Открыть график инструмента в новом окне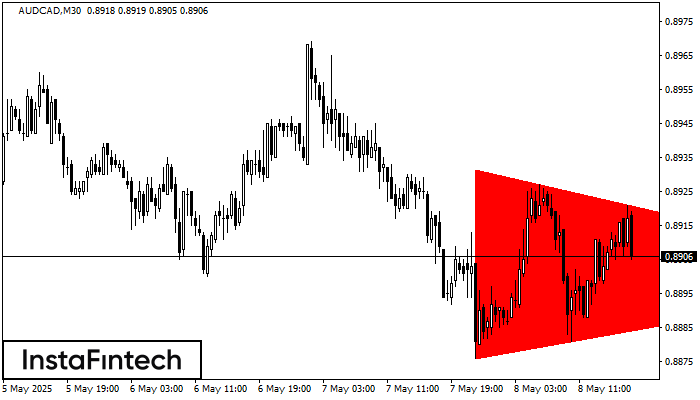
По AUDCAD M30 сформировалась фигура «Медвежий симметричный треугольник». Данная фигура сигнализирует нам о продолжении нисходящего тренда в случае пробоя нижней границы 0.8876, где вероятная прибыль будет являться шириной текущей фигуры
Открыть график инструмента в новом окне


