

сила сигнала 1 из 5

По #Bitcoin на M5 сформировалась фигура «Прямоугольник». Фигура данного типа относится к тому типу продолжения тренда, который содержит в себе два уровня: Сопротивление 85457.12; Поддержка 85308.07. В случае пробоя уровня сопротивления 85457.12 возможно дальнейшее восходящее движение.
Таймфреймы М5 и М15 могут иметь больше ложных точек входа.
- Все
- Вымпел
- Голова и плечи
- Двойная вершина
- Прямоугольник
- Треугольник
- Тройная вершина
- Флаг
- Все
- #AAPL
- #AMZN
- #Bitcoin
- #EBAY
- #FB
- #GOOG
- #INTC
- #KO
- #MA
- #MCD
- #MSFT
- #NTDOY
- #PEP
- #TSLA
- #TWTR
- AUDCAD
- AUDCHF
- AUDJPY
- AUDUSD
- EURCAD
- EURCHF
- EURGBP
- EURJPY
- EURNZD
- EURRUB
- EURUSD
- GBPAUD
- GBPCHF
- GBPJPY
- GBPUSD
- GOLD
- NZDCAD
- NZDCHF
- NZDJPY
- NZDUSD
- SILVER
- USDCAD
- USDCHF
- USDJPY
- USDRUB
- Все
- M5
- M15
- M30
- H1
- D1
- Все
- Покупка
- Продажа
- Все
- 1
- 2
- 3
- 4
- 5
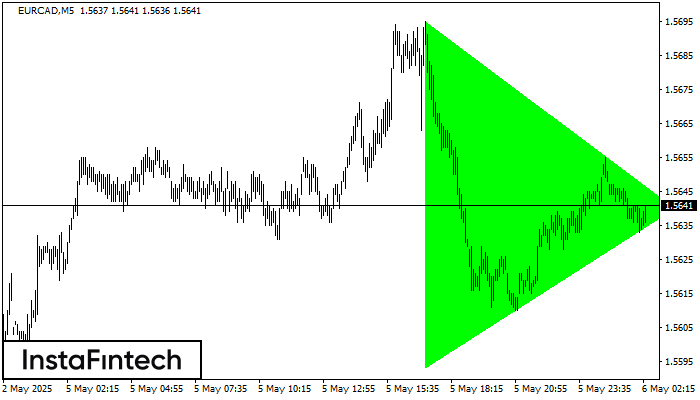
According to the chart of M5, EURCAD formed the Bullish Symmetrical Triangle pattern. The lower border of the pattern touches the coordinates 1.5593/1.5640 whereas the upper border goes across 1.5695/1.5640
The M5 and M15 time frames may have more false entry points.
Open chart in a new window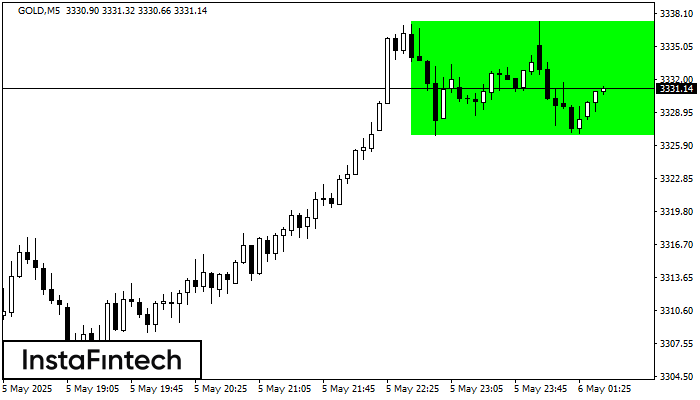
According to the chart of M5, GOLD formed the Bullish Rectangle. This type of a pattern indicates a trend continuation. It consists of two levels: resistance 3337.37 and support 3326.83
The M5 and M15 time frames may have more false entry points.
Open chart in a new window
The Triple Bottom pattern has formed on the chart of USDJPY M5. Features of the pattern: The lower line of the pattern has coordinates 143.80 with the upper limit 143.80/143.76
The M5 and M15 time frames may have more false entry points.
Open chart in a new window


