

сила сигнала 1 из 5
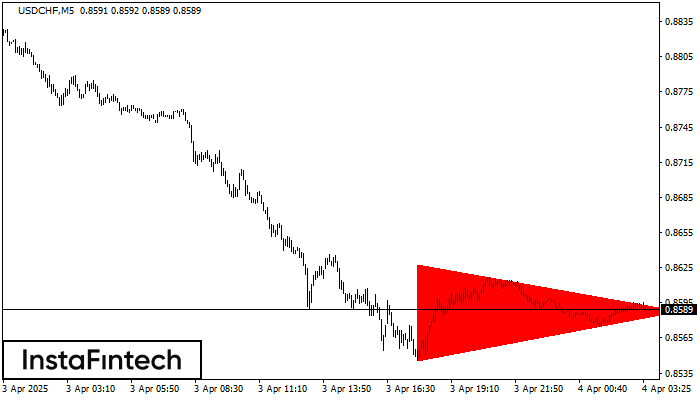
На графике USDCHF M5 сформировалась фигура «Медвежий симметричный треугольник». Характеристика фигуры: Нижняя граница 0.8546/0.8588; Верхняя граница 0.8628/0.8588; Проекция ширины фигуры -82 пунктов. Формирование фигуры «Медвежий симметричный треугольник» наиболее вероятным образом свидетельствует о продолжении нисходящего тренда. Это означает, что курс USDCHF, в случае срабатывания фигуры, пробьет нижнюю границу и, вероятно, проследует к 0.8573.
Таймфреймы М5 и М15 могут иметь больше ложных точек входа.
Shuningdek ko'ring
- Все
- Вымпел
- Голова и плечи
- Двойная вершина
- Прямоугольник
- Треугольник
- Тройная вершина
- Флаг
- Все
- #AAPL
- #AMZN
- #Bitcoin
- #EBAY
- #FB
- #GOOG
- #INTC
- #KO
- #MA
- #MCD
- #MSFT
- #NTDOY
- #PEP
- #TSLA
- #TWTR
- AUDCAD
- AUDCHF
- AUDJPY
- AUDUSD
- EURCAD
- EURCHF
- EURGBP
- EURJPY
- EURNZD
- EURRUB
- EURUSD
- GBPAUD
- GBPCHF
- GBPJPY
- GBPUSD
- GOLD
- NZDCAD
- NZDCHF
- NZDJPY
- NZDUSD
- SILVER
- USDCAD
- USDCHF
- USDJPY
- USDRUB
- Все
- M5
- M15
- M30
- H1
- D1
- Все
- Покупка
- Продажа
- Все
- 1
- 2
- 3
- 4
- 5
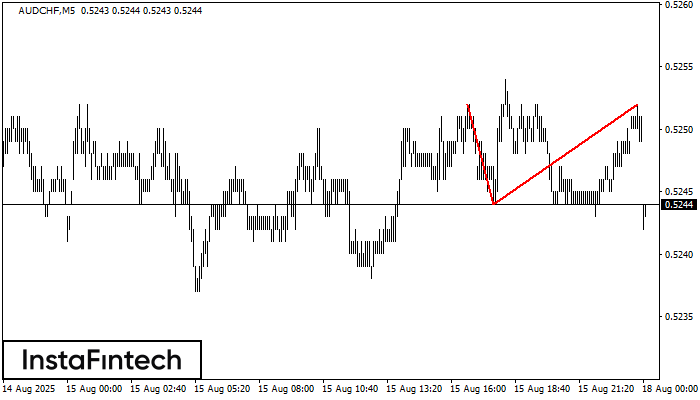
On the chart of AUDCHF M5 the Double Top reversal pattern has been formed. Characteristics: the upper boundary 0.5252; the lower boundary 0.5244; the width of the pattern 8 points
The M5 and M15 time frames may have more false entry points.
Открыть график инструмента в новом окне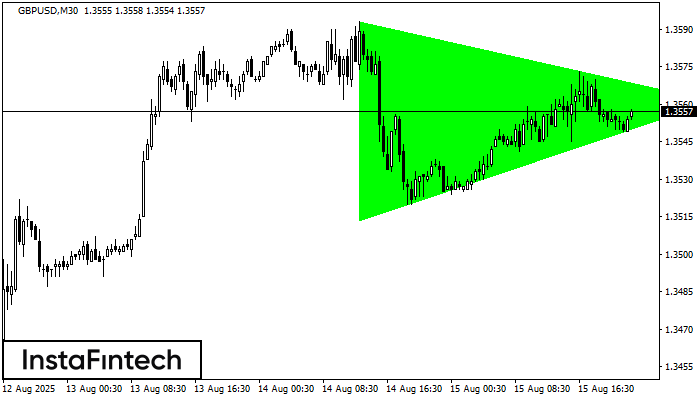
According to the chart of M30, GBPUSD formed the Bullish Symmetrical Triangle pattern, which signals the trend will continue. Description. The upper border of the pattern touches the coordinates 1.3593/1.3561
Открыть график инструмента в новом окне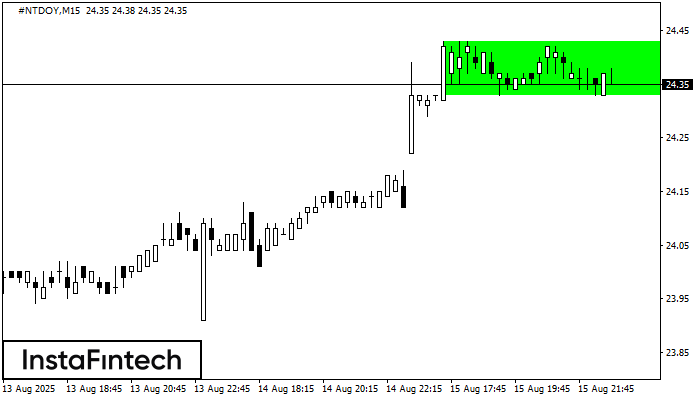
According to the chart of M15, #NTDOY formed the Bullish Rectangle. The pattern indicates a trend continuation. The upper border is 24.43, the lower border is 24.33. The signal means
The M5 and M15 time frames may have more false entry points.
Открыть график инструмента в новом окне


