

signal strength 2 of 5
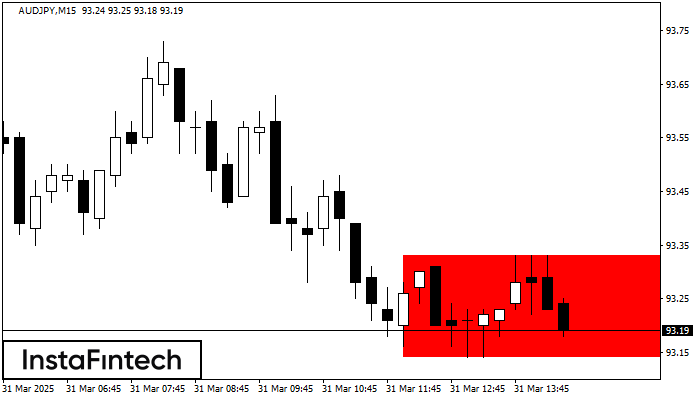
According to the chart of M15, AUDJPY formed the Bearish Rectangle. This type of a pattern indicates a trend continuation. It consists of two levels: resistance 93.33 - 0.00 and support 93.14 – 93.14. In case the resistance level 93.14 - 93.14 is broken, the instrument is likely to follow the bearish trend.
The M5 and M15 time frames may have more false entry points.
Xem thêm
- All
- Double Top
- Flag
- Head and Shoulders
- Pennant
- Rectangle
- Triangle
- Triple top
- All
- #AAPL
- #AMZN
- #Bitcoin
- #EBAY
- #FB
- #GOOG
- #INTC
- #KO
- #MA
- #MCD
- #MSFT
- #NTDOY
- #PEP
- #TSLA
- #TWTR
- AUDCAD
- AUDCHF
- AUDJPY
- AUDUSD
- EURCAD
- EURCHF
- EURGBP
- EURJPY
- EURNZD
- EURRUB
- EURUSD
- GBPAUD
- GBPCHF
- GBPJPY
- GBPUSD
- GOLD
- NZDCAD
- NZDCHF
- NZDJPY
- NZDUSD
- SILVER
- USDCAD
- USDCHF
- USDJPY
- USDRUB
- All
- M5
- M15
- M30
- H1
- D1
- All
- Buy
- Sale
- All
- 1
- 2
- 3
- 4
- 5
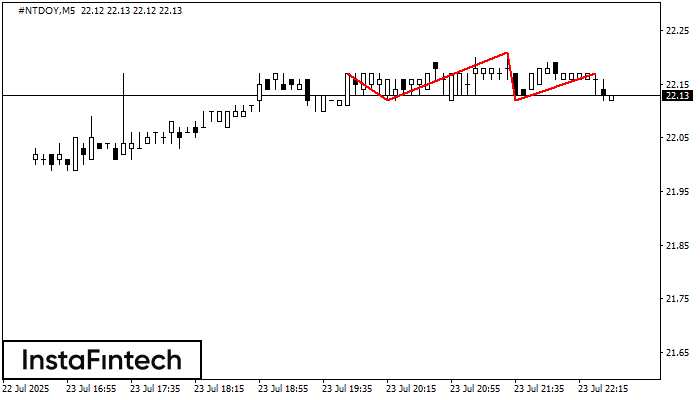
Mô hình kỹ thuật có tên Đầu và vai đã xuất hiện trên biểu đồ #NTDOY M5. Có nhiều lý do quan trọng để đề xuất rằng giá sẽ vượt
Khung thời gian M5 và M15 có thể có nhiều điểm vào lệnh sai hơn.
Open chart in a new window
#NTDOY M5 đã hình thành mô hình Đầu và vai với các tính năng sau: Đỉnh của Đầu là 22.21, Đường viền cổ và góc hướng lên là 22.12/22.12
Khung thời gian M5 và M15 có thể có nhiều điểm vào lệnh sai hơn.
Open chart in a new window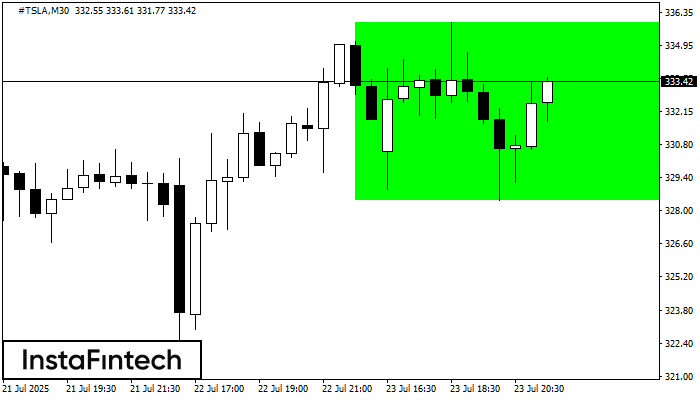
Theo biểu đồ của M30, #TSLA đã hình thành Hình chữ nhật tăng, cái mà là mô hình của sự tiếp tục xu hướng. Mô hình này được chứa trong
Open chart in a new window


