empty
was formed on 15.04 at 22:01:27 (UTC+0)
signal strength 3 of 5
Bullish Rectangle NZDCHF M30

According to the chart of M30, NZDCHF formed the Bullish Rectangle. This type of a pattern indicates a trend continuation. It consists of two levels: resistance 0.4859 and support 0.4839. In case the resistance level 0.4859 - 0.4859 is broken, the instrument is likely to follow the bullish trend.

Xem thêm

Figure
  • All
  • Double Top
  • Flag
  • Head and Shoulders
  • Pennant
  • Rectangle
  • Triangle
  • Triple top
Instrument
  • All
  • #AAPL
  • #AMZN
  • #Bitcoin
  • #EBAY
  • #FB
  • #GOOG
  • #INTC
  • #KO
  • #MA
  • #MCD
  • #MSFT
  • #NTDOY
  • #PEP
  • #TSLA
  • #TWTR
  • AUDCAD
  • AUDCHF
  • AUDJPY
  • AUDUSD
  • EURCAD
  • EURCHF
  • EURGBP
  • EURJPY
  • EURNZD
  • EURRUB
  • EURUSD
  • GBPAUD
  • GBPCHF
  • GBPJPY
  • GBPUSD
  • GOLD
  • NZDCAD
  • NZDCHF
  • NZDJPY
  • NZDUSD
  • SILVER
  • USDCAD
  • USDCHF
  • USDJPY
  • USDRUB
Timeframe
  • All
  • M5
  • M15
  • M30
  • H1
  • D1
Trend
  • All
  • Buy
  • Sale
Signal Strength
  • All
  • 1
  • 2
  • 3
  • 4
  • 5
Topo duplo
was formed on 26.06 at 20:10:48 (UTC+0)
signal strength 1 of 5
Topo duplo AUDCHF M5

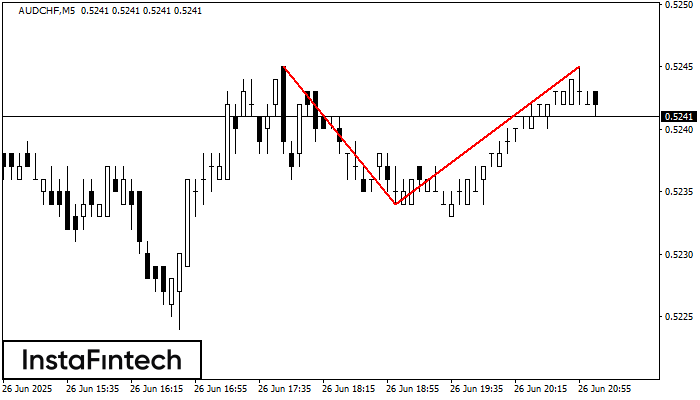
O padrão de reversão Topo duplo foi formado em AUDCHF M5. Características: o limite superior 0.5245; o limite inferior 0.5234; a largura do padrão é de 11 pontos. As operações

Os intervalos M5 e M15 podem ter mais pontos de entrada falsos.

Open chart in a new window
Topo triplo
was formed on 26.06 at 20:05:46 (UTC+0)
signal strength 1 of 5
Topo triplo AUDJPY M5

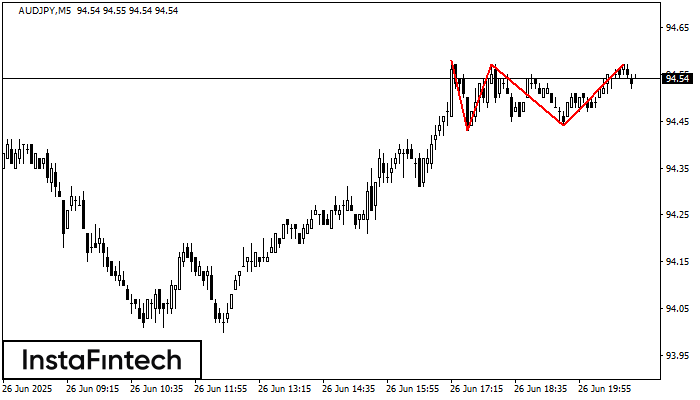
No gráfico do instrumento de negociação AUDJPY M5, o padrão Topo triplo que sinaliza uma mudança de tendência se formou. É possível que após a formação do terceiro pico

Os intervalos M5 e M15 podem ter mais pontos de entrada falsos.

Open chart in a new window
Triângulo Simétrico de Baixa
was formed on 26.06 at 19:45:14 (UTC+0)
signal strength 2 of 5
Triângulo Simétrico de Baixa #TSLA M15

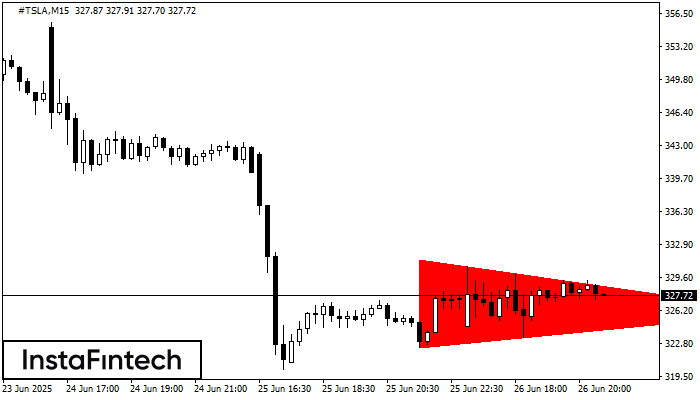
De acordo com o gráfico de M15, #TSLA fomrou o padrão de Triângulo Simétrico de Baixa. Este padrão sinaliza uma nova tendência de baixa se o limite inferior 322.39

Os intervalos M5 e M15 podem ter mais pontos de entrada falsos.

Open chart in a new window
Không thể nói chuyện ngay bây giờ?
Đặt câu hỏi của bạn trong phần trò chuyện.
Widget callback
 

Dear visitor,

Your IP address shows that you are currently located in the USA. If you are a resident of the United States, you are prohibited from using the services of InstaFintech Group including online trading, online transfers, deposit/withdrawal of funds, etc.

If you think you are seeing this message by mistake and your location is not the US, kindly proceed to the website. Otherwise, you must leave the website in order to comply with government restrictions.

Why does your IP address show your location as the USA?

  • - you are using a VPN provided by a hosting company based in the United States;
  • - your IP does not have proper WHOIS records;
  • - an error occurred in the WHOIS geolocation database.

Please confirm whether you are a US resident or not by clicking the relevant button below. If you choose the wrong option, being a US resident, you will not be able to open an account with InstaForex anyway.

We are sorry for any inconvenience caused by this message.